Analyst Estimates History
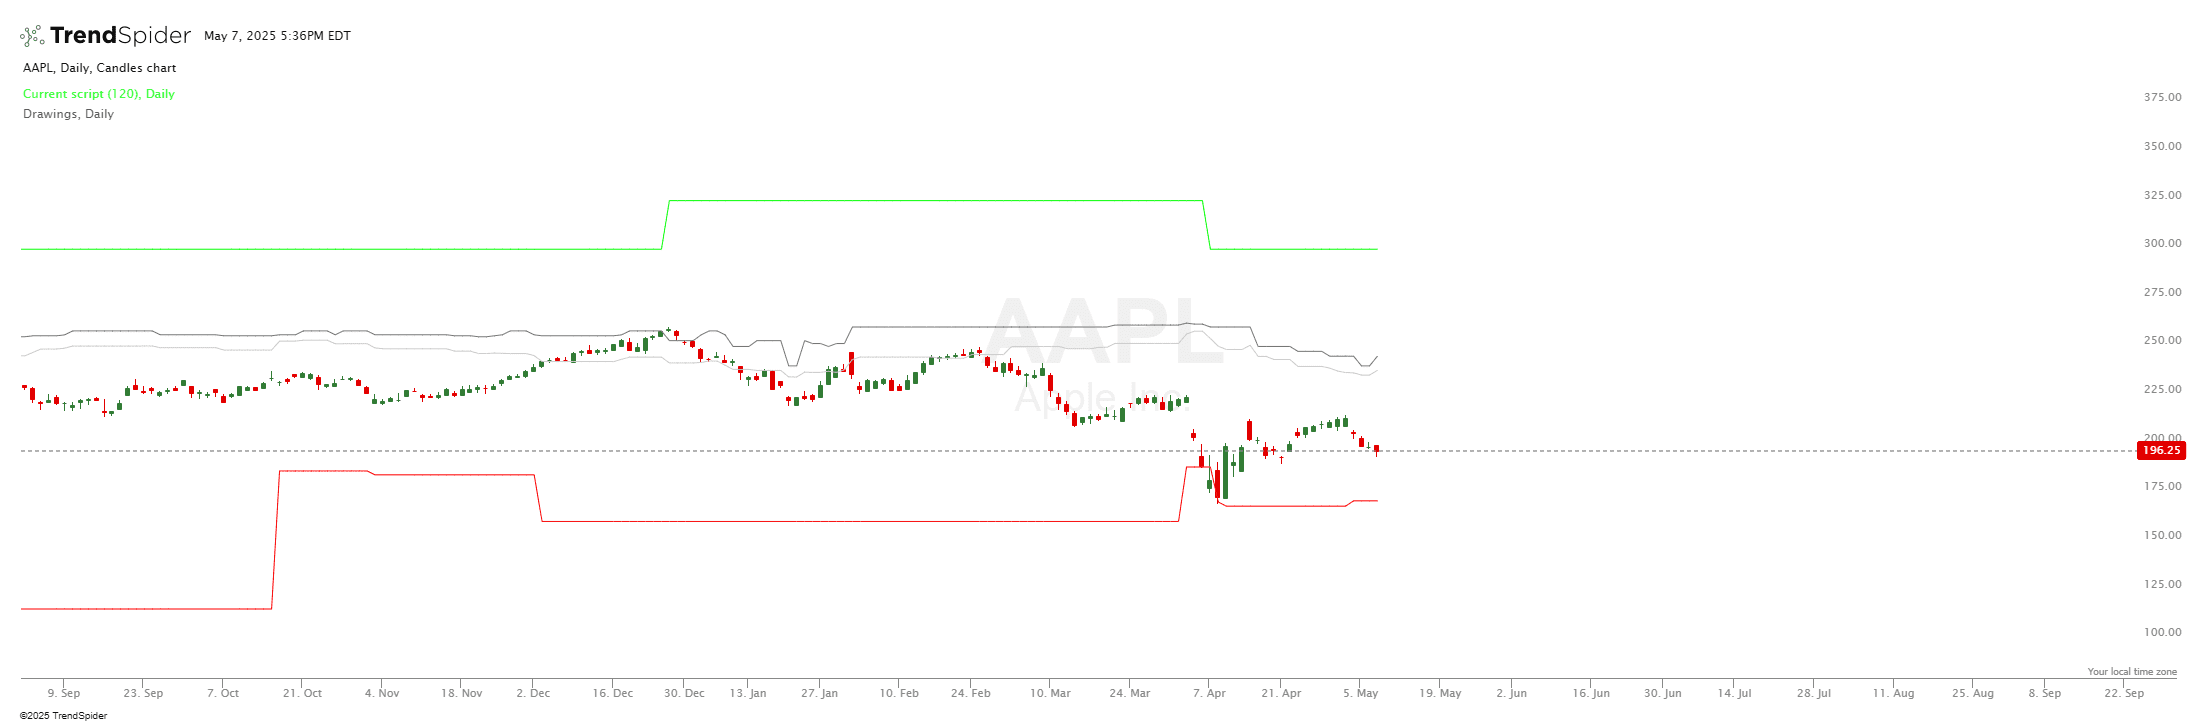
This indicator will show you the history of analyst estimates. This includes the the minimum, maximum, average, and median analyst estimate. These levels will be painted on your chart.
Source code
This indicator had been implemented by TrendSpider Team in JavaScript on TrendSpider. Check out the developer documentation to learn more about JS on TrendSpider.
describe_indicator('Analyst Estimates History', { warmup: 1200 });
const jstat = library('jstat');

const REPORT_RELEVANCE_DAYS = input.number('Report life time days', 120, { min: 30, max: 600 });


async function loadDataInPages(maxPages = 3) {
	let data = [];
	let mostDistantTimestamp = null;

	for (let pageIndex = 0; pageIndex < maxPages; pageIndex += 1) {
		const currentPageContent = await (pageIndex === 0
			? request.analyst_ratings(current.ticker)
			: request.analyst_ratings(current.ticker, { filters: [{ field: 'timestamp', filter: 'less', value: mostDistantTimestamp }]})
		);

		if (!currentPageContent || currentPageContent.error || currentPageContent.length === 0) {
			break;
		}

		mostDistantTimestamp = currentPageContent[0].timestamp;
		data = data.concat(currentPageContent);
	}

	return data.sort((a, b) => a.timestamp - b.timestamp);
}


const aeData = await loadDataInPages(2);
const dataLanded = land_points_onto_series(aeData.map(record => record.timestamp), aeData, time, 'ge', (existingPointValue, newPointValue) => {
	if (!existingPointValue) {
		return [newPointValue];
	}

	return Array.isArray(existingPointValue)
		? [...existingPointValue, newPointValue]
		: [existingPointValue, newPointValue];
});

const maxEstimate = series_of(null);
const minEstimate = series_of(null);
const midEstimate = series_of(null);
const medianEstimate = series_of(null);

const lastReportByAnalyst = {};
let lastMaxEstimate = null;
let lastMinEstimate = null;
let lastMidEstimate = null;
let lastMedianEstimate = null;

for (let candleIndex = 0; candleIndex < time.length; candleIndex += 1) {
	let reportsAtThatCandle = dataLanded[candleIndex];

	if (reportsAtThatCandle) {
		if (!Array.isArray(reportsAtThatCandle)) {
			reportsAtThatCandle = [reportsAtThatCandle];
		}

		for (const report of reportsAtThatCandle) {
			lastReportByAnalyst[report.analystPerson] = report;
		}
	}

	const lastReportsByAnalysts = Object.values(lastReportByAnalyst);

	const allEstimatesRelevantSoFar = lastReportsByAnalysts.
		filter(report => report.pTarget > 0 && time[candleIndex] - report.timestamp < REPORT_RELEVANCE_DAYS * 1440 * 60).
		map(report => report.pTarget);

	if (allEstimatesRelevantSoFar.length > 0) {
		lastMaxEstimate = jstat.max(allEstimatesRelevantSoFar);
		lastMinEstimate = jstat.min(allEstimatesRelevantSoFar);
		lastMidEstimate = jstat.mean(allEstimatesRelevantSoFar) || lastMidEstimate;
		lastMedianEstimate = jstat.median(allEstimatesRelevantSoFar) || lastMedianEstimate;
	}

	maxEstimate[candleIndex] = lastMaxEstimate;
	minEstimate[candleIndex] = lastMinEstimate;
	midEstimate[candleIndex] = lastMidEstimate;
	medianEstimate[candleIndex] = lastMedianEstimate;
}

paint(maxEstimate, { name: 'Max', color: 'lime', ignoreWhenScaling: true });
paint(midEstimate, { name: 'Average', color: '#ccc', ignoreWhenScaling: true });
paint(medianEstimate, { name: 'Median', color: '#777', ignoreWhenScaling: true });
paint(minEstimate, { name: 'Min', color: 'red', ignoreWhenScaling: true });
Automated technical analysis software. For traders, by traders.