Institutional Supply and Demand Zones
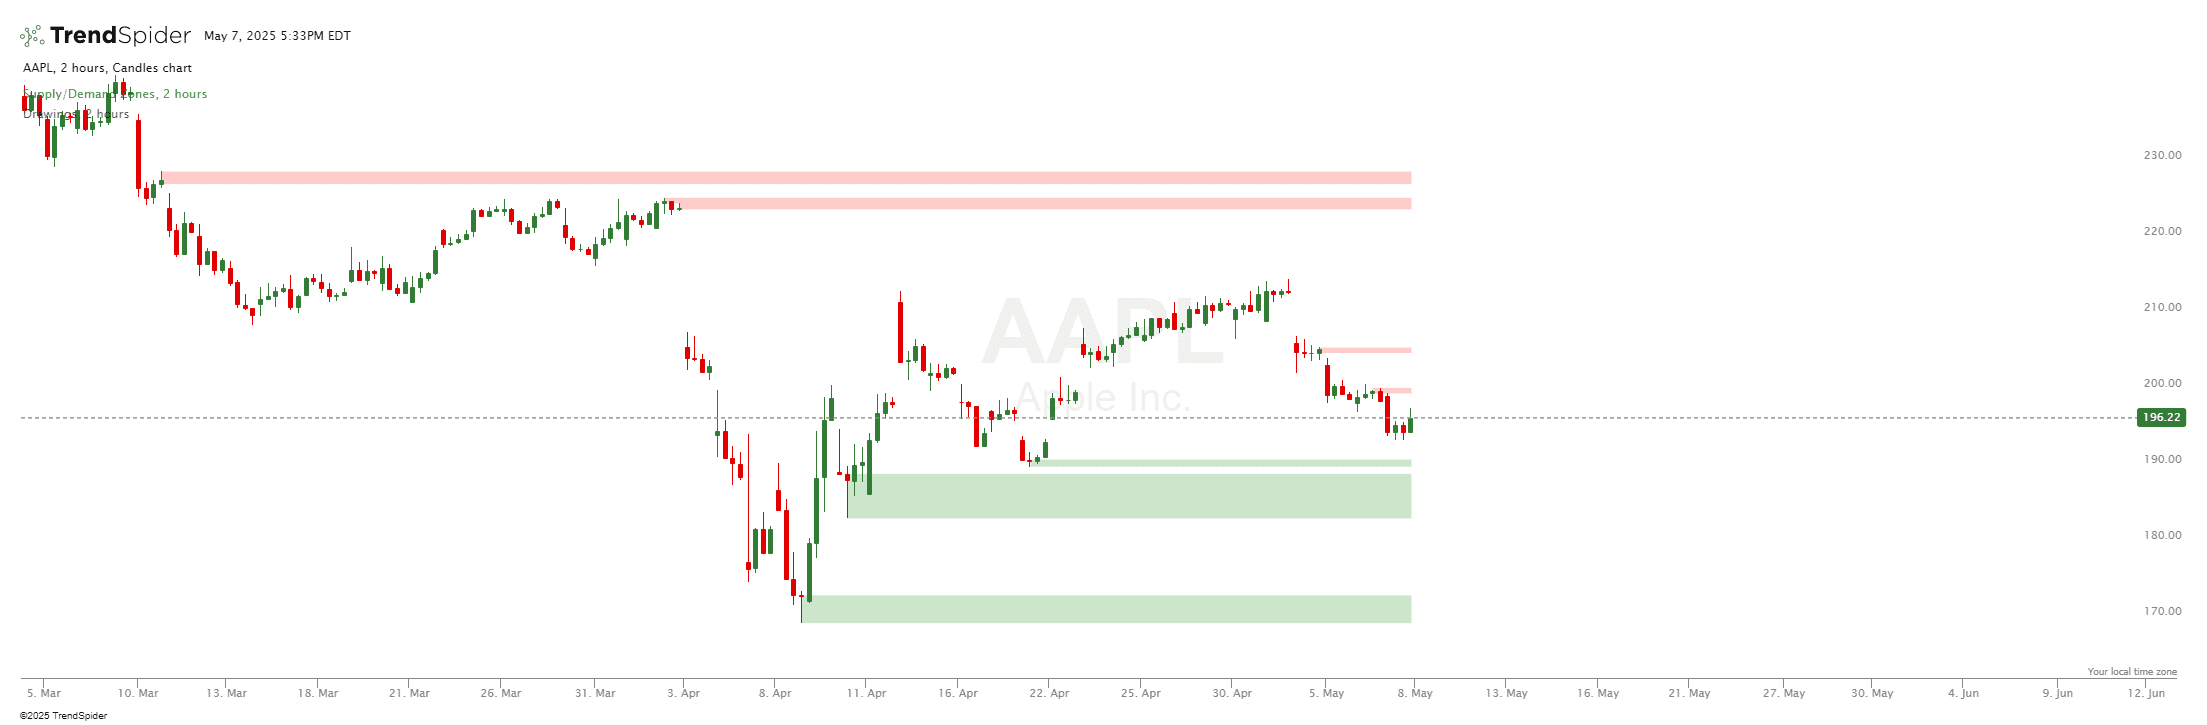
The Institutional Supply and Demand Zones indicator is designed to visually represent critical areas on the chart where significant buying (demand zones) or selling (supply zones) pressure has historically occurred. This innovative tool dynamically identifies these zones by analyzing fractals over a specific period, capturing areas where institutional investors may have concentrated their orders. With a focus on the most recent 5 zones for both supply and demand, this indicator ensures that traders have access to current and relevant market insights without overcrowding the chart. P.S. Currently, this script will paint 5 zones, but there is a variable in the third line of the code where you can change this.
Source code
This indicator had been implemented by TrendSpider Team in JavaScript on TrendSpider. Check out the developer documentation to learn more about JS on TrendSpider.
describe_indicator('Institutional Supply and Demand Zones', 'price', { shortName: 'Supply/Demand Zones' });
// Use this value to set the maximum number of zones. Without this maximum number the saved indicator will not paint any.
const maxNumberOfAreas = 5;
let series = for_every(open, high, close, low, function (o, h, c, l, lastOHCL, index) {
    if (index === 0) {
        lastOHCL = { o: o, h: h, c: c, l: l, demandZones: [], supplyZones: [] };
        return lastOHCL;
    }
    lastOHCL.demandZones.forEach(function (value, index) {
        if (l < value.bottom) {
            delete lastOHCL.demandZones[index];
        }
    });
    lastOHCL.supplyZones.forEach(function (value, index) {
        if (h > value.top) {
            delete lastOHCL.supplyZones[index];
        }
    });
    if (lastOHCL.o > lastOHCL.c) {
        // red prev candle, get body size
        const prevCandleBodySize = lastOHCL.o - lastOHCL.c;
        if (c > o) {
            // current candle is green
            const currentCandleBodySize = c - o;
            if (((currentCandleBodySize >= (prevCandleBodySize * 2) && lastOHCL.l <= l) || ((o <= lastOHCL.c) && (c >= lastOHCL.o)))) {
                // we have a demand zone!
                const top = lastOHCL.o;
                let bottom, demandZoneIndex;
                if (o <= lastOHCL.c) {
                    if (lastOHCL.l < l) {
                        bottom = lastOHCL.l;
                        demandZoneIndex = index - 1;
                    } else {
                        bottom = l;
                        demandZoneIndex = index;
                    }
                } else {
                    bottom = lastOHCL.l
                }
                if (Array.isArray(lastOHCL.demandZones)) {
                    lastOHCL.demandZones[index - 1] = { top: top, bottom: bottom };
                } else {
                    lastOHCL.demandZones = [];
                }
            }
        }
    } else if (lastOHCL.o < lastOHCL.c) {
        // green prev candle
        const prevCandleBodySize = lastOHCL.c - lastOHCL.o;
        if (c < o) {
            // current candle is red
            const currentCandleBodySize = o - c;
            if (((currentCandleBodySize >= (prevCandleBodySize * 2) && lastOHCL.h >= h) || ((o >= lastOHCL.c) && (c <= lastOHCL.o)))) {
                // we have a supply zone!
                const bottom = lastOHCL.o;
                let top, supplyZoneIndex;
                if (o >= lastOHCL.c) {
                    if (lastOHCL.h < h) {
                        top = h;
                        supplyZoneIndex = index;
                    } else {
                        top = lastOHCL.h;
                        supplyZoneIndex = index - 1;
                    }
                } else {
                    top = lastOHCL.h;
                }
                if (Array.isArray(lastOHCL.supplyZones)) {
                    lastOHCL.supplyZones[index - 1] = { top: top, bottom: bottom };
                } else {
                    lastOHCL.supplyZones = [];
                }
            }
        }
    } else if (lastOHCL.o === lastOHCL.c) {
        // handle the scenario when the last candle was a perfect doji
        const prevCandleBodySize = 0;
        if (c > o) {
            // current candle is green
            const currentCandleBodySize = c - o;
            if (((currentCandleBodySize >= (prevCandleBodySize * 2) && lastOHCL.l <= l) || ((o <= lastOHCL.c) && (c >= lastOHCL.o)))) {
                // we have a demand zone!
                const top = lastOHCL.o;
                let bottom, demandZoneIndex;
                if (o <= lastOHCL.c) {
                    if (lastOHCL.l < l) {
                        bottom = lastOHCL.l;
                        demandZoneIndex = index - 1;
                    } else {
                        bottom = l;
                        demandZoneIndex = index;
                    }
                } else {
                    bottom = lastOHCL.l
                }
                if (Array.isArray(lastOHCL.demandZones)) {
                    lastOHCL.demandZones[index - 1] = { top: top, bottom: bottom };
                } else {
                    lastOHCL.demandZones = [];
                }
            }
        }
        if (c < o) {
            // current candle is red
            const currentCandleBodySize = o - c;
            if (((currentCandleBodySize >= (prevCandleBodySize * 2) && lastOHCL.h >= h) || ((o >= lastOHCL.c) && (c <= lastOHCL.o)))) {
                // we have a supply zone!
                const bottom = lastOHCL.o;
                let top, supplyZoneIndex;
                if (o >= lastOHCL.c) {
                    if (lastOHCL.h < h) {
                        top = h;
                        supplyZoneIndex = index;
                    } else {
                        top = lastOHCL.h;
                        supplyZoneIndex = index - 1;
                    }
                } else {
                    top = lastOHCL.h;
                }
                if (Array.isArray(lastOHCL.supplyZones)) {
                    lastOHCL.supplyZones[index - 1] = { top: top, bottom: bottom };
                } else {
                    lastOHCL.supplyZones = [];
                }
            }
        }
    }
    lastOHCL = { o: o, h: h, c: c, l: l, demandZones: lastOHCL.demandZones, supplyZones: lastOHCL.supplyZones };
    return lastOHCL;
});
series = series.slice(-1);
const demandZones = series[0].demandZones;
const supplyZones = series[0].supplyZones;
for (let areaIndex = 0; areaIndex < maxNumberOfAreas; areaIndex++) {
    const demandZoneIndex = (Object.keys(demandZones).length >= areaIndex) ?
        Object.keys(demandZones)[Object.keys(demandZones).length - areaIndex - 1] :
        null;
    const demandZone = demandZoneIndex ?
        demandZones[demandZoneIndex] :
        { top: null, bottom: null };
    fill(paint(horizontal_line(demandZone.top, demandZoneIndex), 'Demand Top ' + areaIndex+1, 'green', 'line', 1, true), paint(horizontal_line(demandZone.bottom, demandZoneIndex), 'Demand Bottom ' + areaIndex+1, 'green', 'line', 1, true), 'green', 0.20, 'Demand');
    const supplyZoneIndex = (Object.keys(supplyZones).length >= areaIndex) ?
        Object.keys(supplyZones)[Object.keys(supplyZones).length - areaIndex - 1] :
        null;
    const supplyZone = supplyZoneIndex ?
        supplyZones[supplyZoneIndex] :
        { top: null, bottom: null };

    fill(paint(horizontal_line(supplyZone.top, supplyZoneIndex), 'Supply Top ' + areaIndex+1, 'red', 'line', 1, true), paint(horizontal_line(supplyZone.bottom, supplyZoneIndex), 'Supply Bottom ' + areaIndex+1, 'red', 'line', 1, true), 'red', 0.20, 'Supply');
}