Volume Flow Indicator
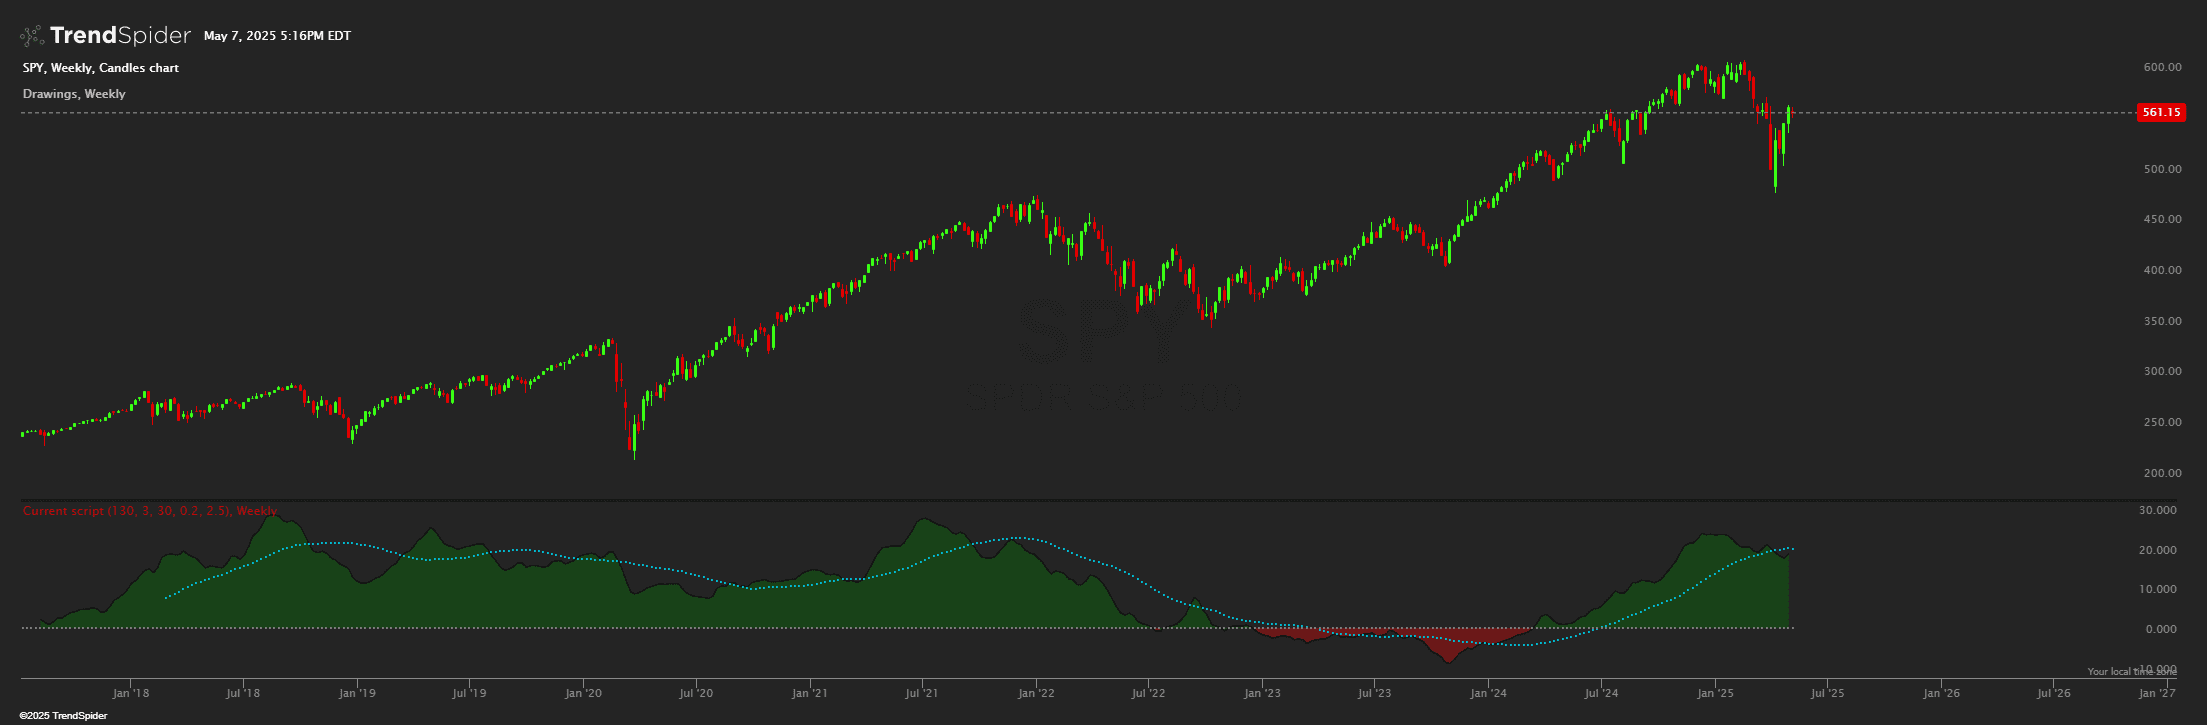
The Volume Flow Indicator (VFI) is a sophisticated technical analysis tool designed for the lower panel of a trading chart, aiming to identify major trends by analyzing volume flows and price movements. This indicator combines several elements to assess buying and selling pressure, incorporating volatility, volume, and price movement into its calculation to offer insights into the potential direction of market trends.
Source code
This indicator had been implemented by TrendSpider Team in JavaScript on TrendSpider. Check out the developer documentation to learn more about JS on TrendSpider.
describe_indicator('Volume Flow Indicator', 'lower');
const period = input('VFI Period', 130, { min: 26, max: 300 });
const smooth = input('Smooth', 3, { min: 1, max: 10 });
const maPeriod = input('MA Period', 30, { min: 20, max: 100 });
const coef = input('Coef', 0.2);
const volCoef = input('Vol Cutoff', 2.5, { min: 1, max: 5 });
const inter = for_every(hlc3, shift(hlc3, 1), (value, previousValue) => Math.log(value) - Math.log(previousValue));
const vinter = stdev(inter, 30 );
const cutoff = mult(vinter, close, coef);
const vave = shift(sma(volume, period), -1);
const vMax = mult(vave, volCoef);
const vC = min_of(volume, vMax);
const mF = for_every(hlc3, shift(hlc3, 1), (value, previousValue) => value - previousValue);
const vCP = for_every(mF, vC, cutoff, (mFValue, vCValue, cOValue) => {
    if (mFValue > cOValue) {
        return vCValue;
    } else if (mFValue < -cOValue) {
        return -vCValue;
    } else {
        return 0;
    };
});
const vFI1 = div(sum(vCP, period), vave);
const vFI = ema(vFI1, smooth);
const mAVFI = sma(vFI, maPeriod);
paint(vFI, "VFI", 'black');
paint(mAVFI, "MAVFI", '#00bcd4', 'dotted');
const zeroLine = horizontal_line(0);
color_cloud(zeroLine, vFI, 'red', 'green');
paint(zeroLine, 'Zero', 'gray', 'dotted');
Automated technical analysis software. For traders, by traders.