Composite index
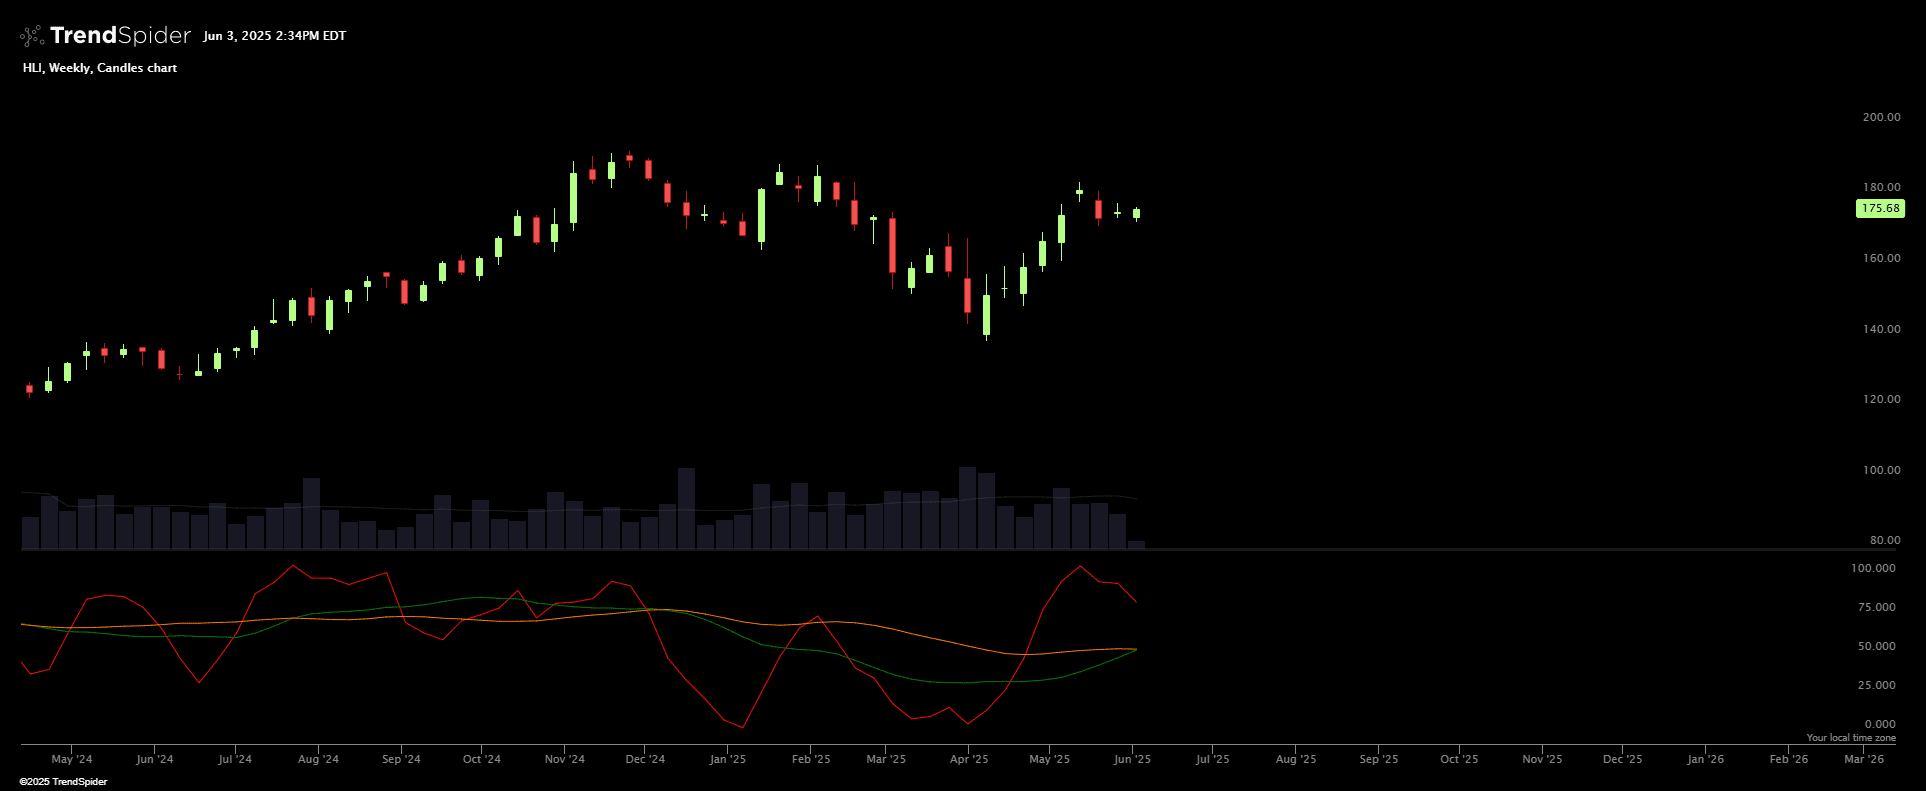
The Composite Index indicator is an advanced analytical tool designed for the lower panel of a trading chart, providing a unique blend of momentum and trend analysis. It diverges from traditional indicators by combining the Relative Strength Index (RSI) with its own momentum and moving averages to create a more comprehensive view of market dynamics.
Source code
This indicator had been implemented by TrendSpider Team in JavaScript on TrendSpider. Check out the developer documentation to learn more about JS on TrendSpider.
describe_indicator('Composite index', 'lower');
const priceSource = input('Price source', 'close', constants.price_source_options);
const rsiLength = input("RSI Length", 14);
const rsiMomLength = input("RSI Momentum Length", 9);
const rsiMaLength = input("RSI MA Length", 3);
const maLength = input("SMA Length", 3);
const fastLength = input("Fast Length", 13);
const slowLength = input("Slow Length", 33);
const price = prices[priceSource];
const rsiMo9 = momentum(rsi(price, rsiLength), rsiMomLength);
const rsi3= sma(rsi(close, rsiMaLength), maLength);
const indicatorLine = add(rsiMo9, rsi3);
paint(indicatorLine, "Plot1", "#ff0000");
paint(sma(indicatorLine, fastLength),"Plot2", "#008000");
paint(sma(indicatorLine, slowLength),"Plot3", "#ff7f00");
Automated technical analysis software. For traders, by traders.