Mansfield Relative Strength
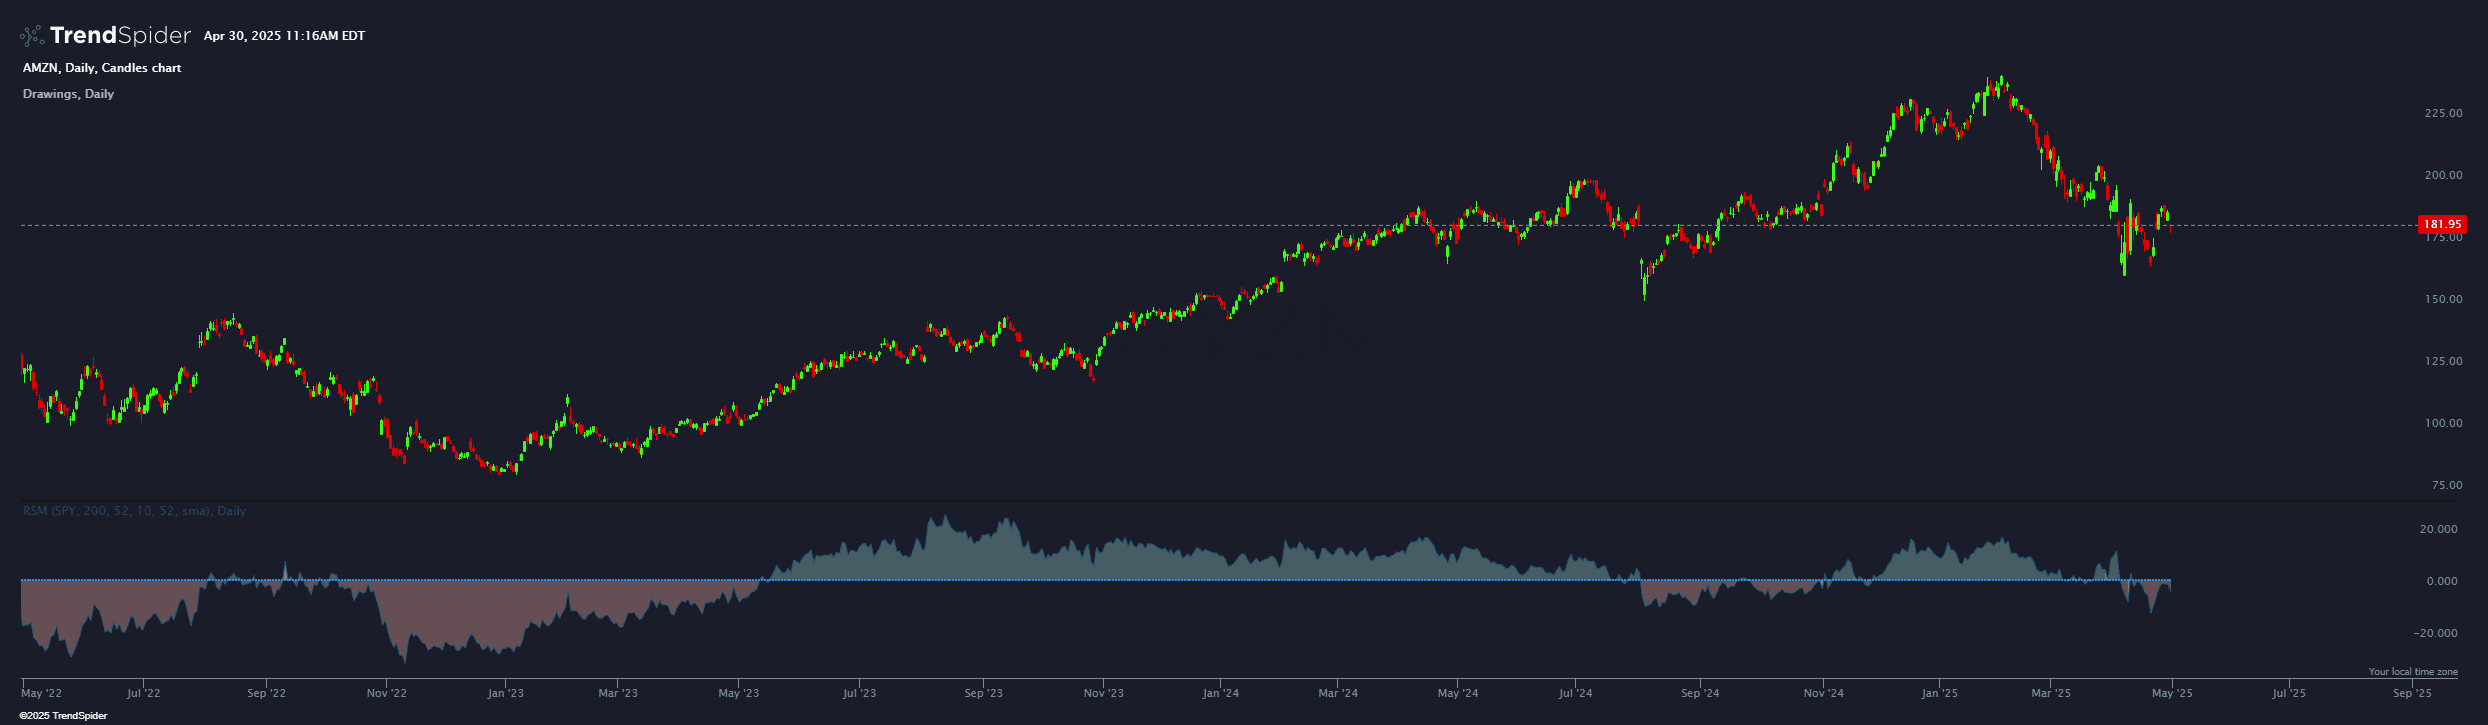
Compares a security's price to its sector index, indicating if it's stronger or weaker within its industry.
Source code
This indicator had been implemented by TrendSpider Team in JavaScript on TrendSpider. Check out the developer documentation to learn more about JS on TrendSpider.
describe_indicator("Mansfield Relative Strength", 'lower', { decimals: 3, shortName: 'RSM', mainColorInheritFrom: 'line'});
const indexSymbol = input.symbol('Index');
const dLength = input.number('Daily length', 200, { min: 1 });
const wLength = input.number('Weekly length', 52, { min: 1 });
const mLength = input.number('Monthly length', 10, { min: 1 });
const oLength = input.number('Other periods length', 52, { min: 1 });
let length;
switch(constants.resolution) {
    case 'D':
        length = dLength;
        break;
    case 'W':
        length = wLength;
        break;
    case 'M':
        length = mLength;
        break;
    default:
        length = oLength;
}
const maType = input('MA type', 'sma', constants.ma_types);
// get a reference to the MA math, according to user's choice in maType input
const computeMA = indicators[maType];
// Convert current resolution to a higher one that contains at least double the amount of candles
const higherResolution = { 1: '2', 2: '4', 3: '6', 4: '10', 5: '10', 6: '12', 10: '30', 12: '30', 15: '30', 30: '60',
                         45: '90', 60: '120', 65: '240', 90: '240', 120: '240', 240: '1440', 1440: 'D', D: 'W',
                         W: 'M', M: 'Q', Q: 'Y', Y: 'Y' }[constants.resolution];
const indexData = await request.history(indexSymbol, higherResolution, {
    ext_session: current.is_ext_hours
});
const indexClose = land_points_onto_series(indexData.time, indexData.close, time, 'ge');
// Set last close as a latest value to avoid missing points due to not yet finalized higher timeframe candle
const lastClose = interpolate_sparse_series(indexClose, 'constant')[close.length - 1];
indexClose[close.length - 1] = lastClose;
const rsd = mult(div(close, interpolate_sparse_series(indexClose, 'constant')), 100);
const rsdMa = computeMA(rsd, length);
const rsm = mult(sub(div(rsd, rsdMa), 1), 100);
paint(rsm, 'Line', '#1e5879');
const zeroLine = horizontal_line(0);
paint(zeroLine, 'Zero', '#2595f3', 'dotted');
color_cloud(rsm, zeroLine, '#9fe2dc', '#ffb2b0');
Automated technical analysis software. For traders, by traders.