P/E Ratio Comparison
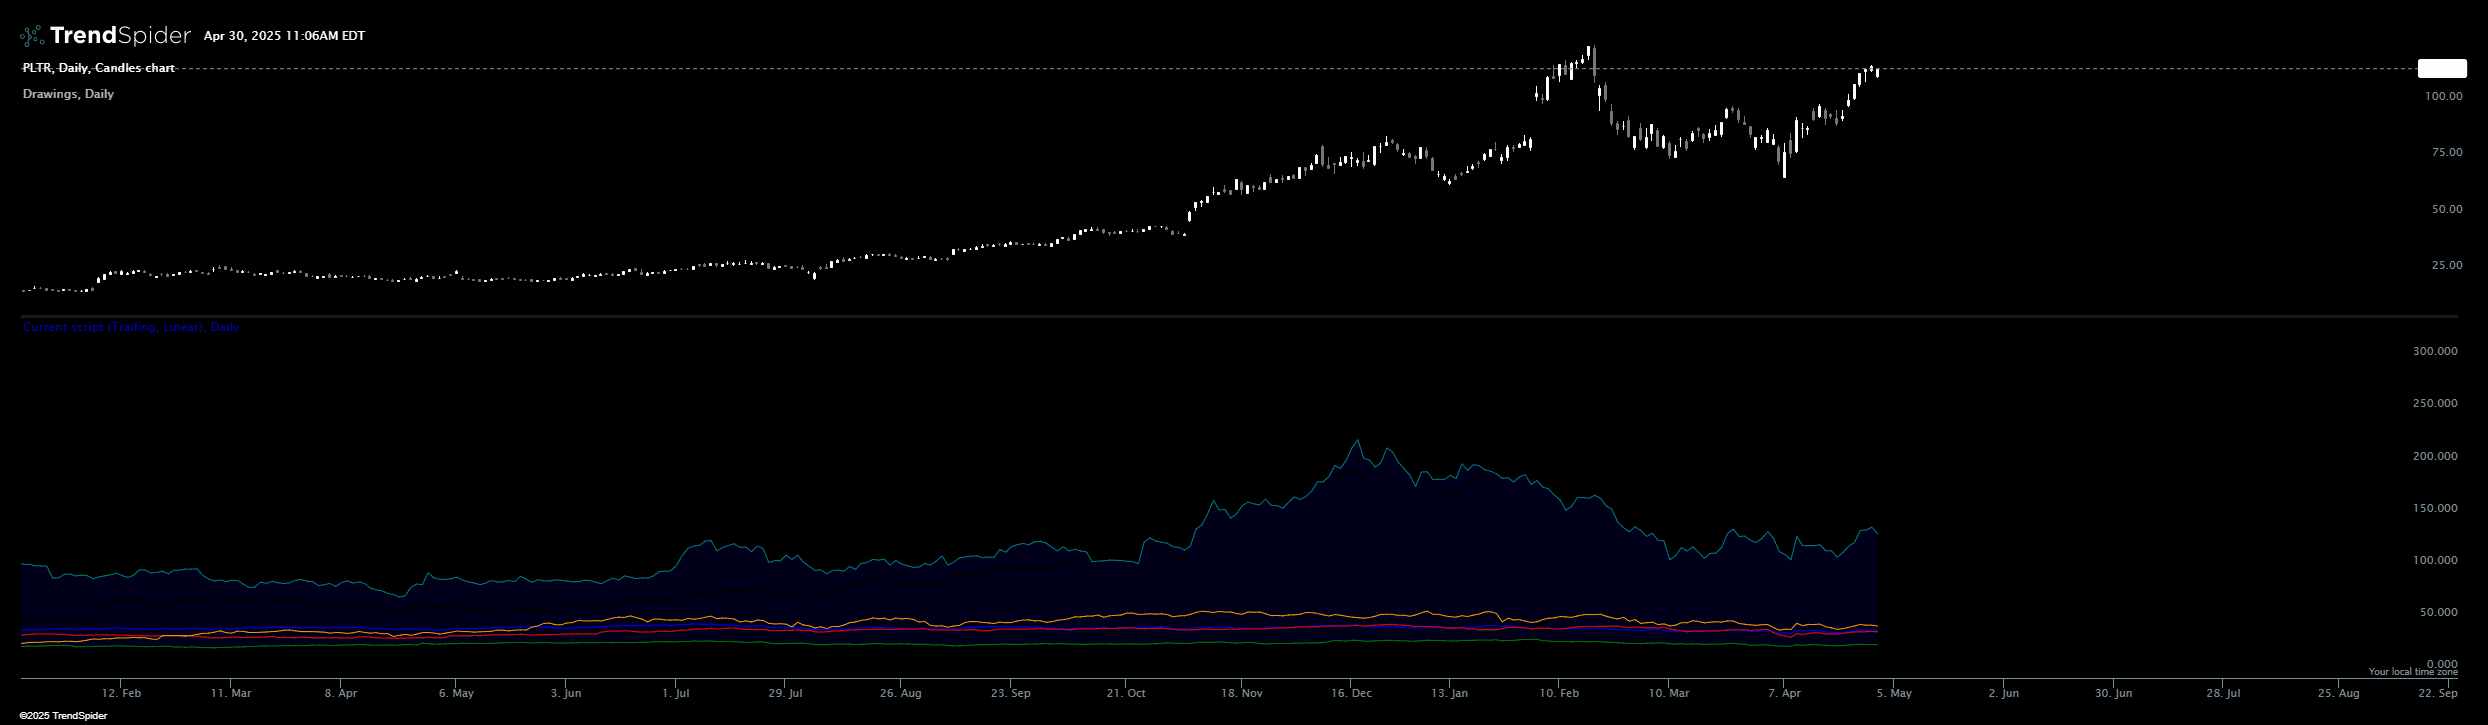
This indicator will plot the Price/Earnings ratio for a particular symbol on the chart allowing you to quickly correlate changes in price to the earnings of an asset. It will only work on US listed companies that publish their Price/Earnings (P/E) ratio.
Source code
This indicator had been implemented by TrendSpider Team in JavaScript on TrendSpider. Check out the developer documentation to learn more about JS on TrendSpider.
describe_indicator('P/E Ratio Comparison', 'lower');

const symbolsToCompareTo = ['MSFT', 'AAPL', 'GOOGL', 'NVDA', 'TSLA'];

const epsMathType = input('P/E Type', 'Trailing', ['Qtr', 'Trailing']);
const scale = input('Scale', 'Linear', ['Linear', 'Log']);


async function computePELine(ticker, options, isReference) {
	const earnings = await request.earnings(ticker);
	const otherAssetPrice = await request.history(ticker, constants.resolution, { land_onto_current_candles: true });

	if (!Array.isArray(earnings)) {
		return;
	}

	const pastEarnings = earnings.filter(record => !record.isFuture);

	let resultingLine = null;

	if (epsMathType == 'Qtr') {
		const epsLanded = land_points_onto_series(
			pastEarnings.map(record => record.timestamp),
			pastEarnings.map(record => record.eps),
			time,
			'ge'
		);

		const epsInterpolated = interpolate_sparse_series(epsLanded, 'constant');
		resultingLine = for_every(otherAssetPrice.close, epsInterpolated, (c, eps) => c / eps);
	}
	else if (epsMathType == 'Trailing') {
		resultingLine = otherAssetPrice.close.map((c, index) => {
			const last4QtrEPS = pastEarnings.
				slice(0, index).
				filter(Boolean).
				slice(-4).
				reduce((result, report) => result + report.eps, 0);

			return c / last4QtrEPS;
		});
	}
	else {
		throw Error('unknown pe type requested');
	}

	if (scale == 'Log') {
		resultingLine = resultingLine.map(Math.log);
	}

	return { line: resultingLine, options, isReference };
}

const ratios = await Promise.all([
	computePELine(constants.ticker, { name: 'PE, Base', thickness: 2 }, false),
	...symbolsToCompareTo.map(symbol => computePELine(symbol, { name: `PE, ${symbol}` }, true))
]);


let maxLine = series_of(-1e6);
let minLine = series_of(1e6);

for (const ratioLine of ratios) {
	paint(ratioLine.line, ratioLine.options);

	if (ratioLine.isReference) {
		maxLine = max_of(maxLine, ratioLine.line);
		minLine = min_of(minLine, ratioLine.line);
	}
}

fill(
	paint(maxLine, { hidden: true }),
	paint(minLine, { hidden: true }),
	'blue',
	0.1
);
Automated technical analysis software. For traders, by traders.