Analyst Estimates: Reports
This indicator will display analyst ratings on the chart to show you how price reacted to the rating. It will work on all US equities that are covered by Wall Street analysts and wirehouse analysts.
Source code
This indicator had been implemented by TrendSpider Team in JavaScript on TrendSpider. Check out the developer documentation to learn more about JS on TrendSpider.
/*
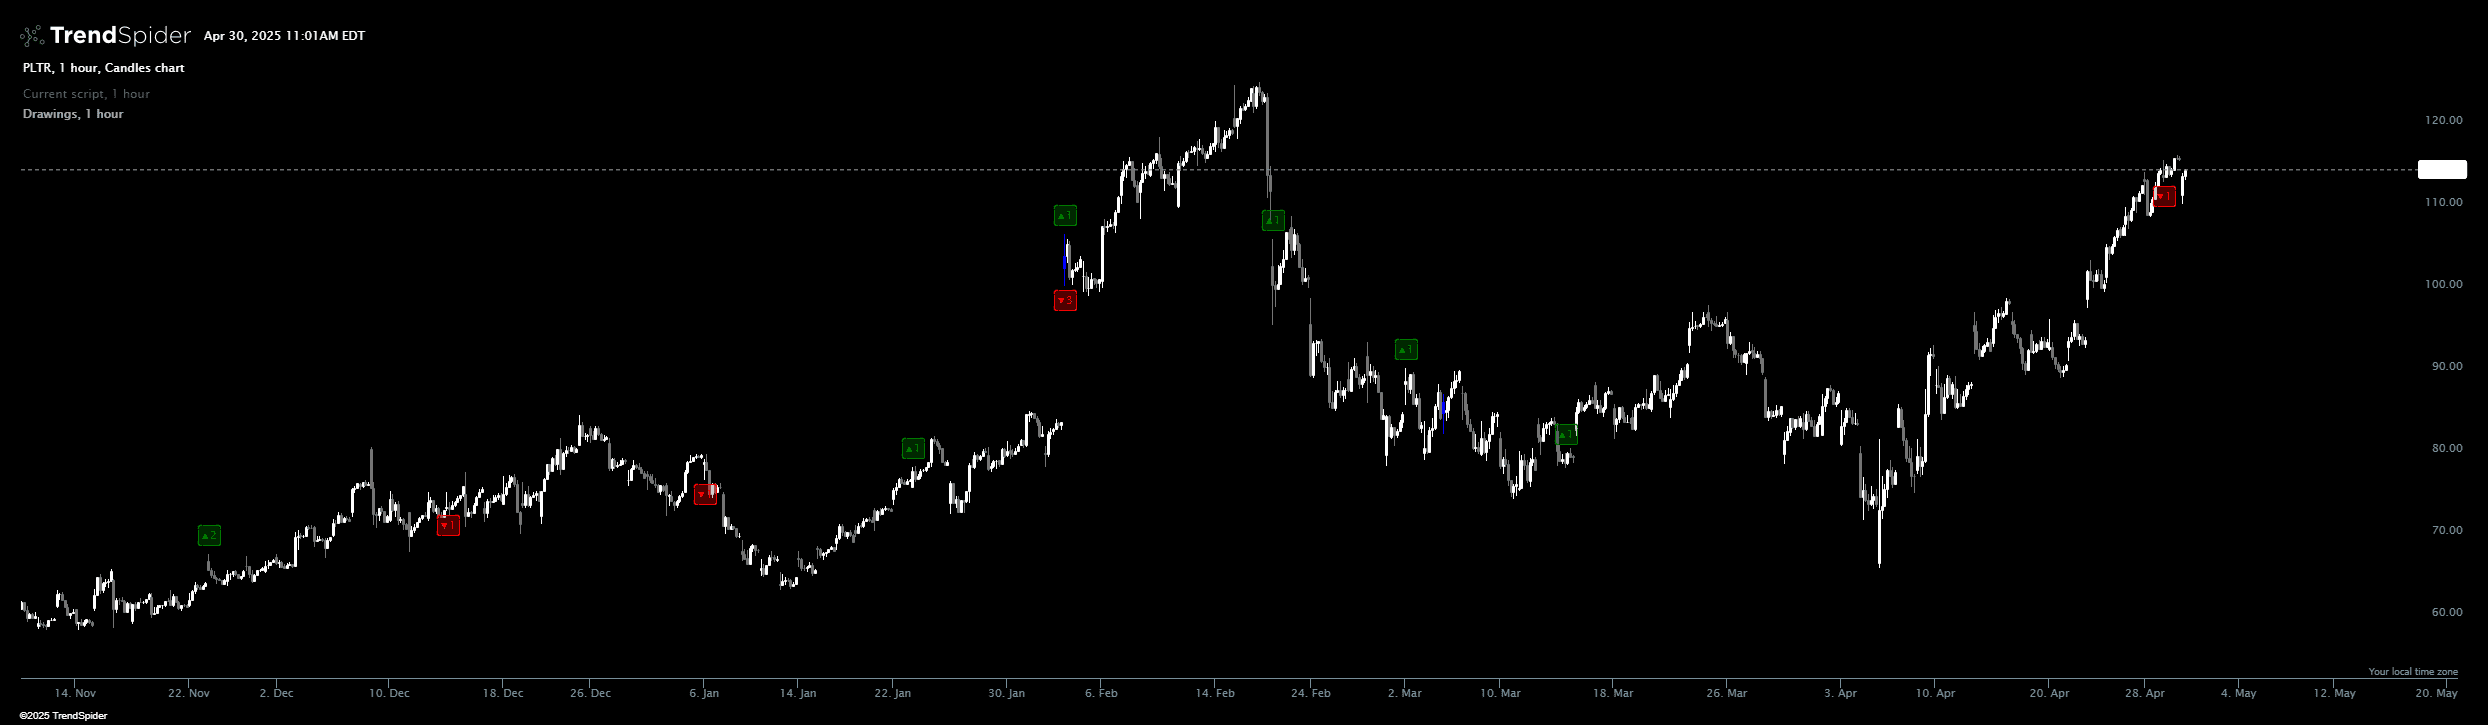
This indicator does 2 things: paints labels and colors candles.
It paints green arrows any time any analyst has released a report for a given symbol,
giving it a rank of Buy. Labels format is "▲{AMOUNT_OF_REPORTS}`"; a record of ▲3 means
that there were 3 reports ranking a stock "Buy" released at a given candle.
The indicator does the same for reprots ranking a stock Sell, painting them in red.
Candles during which there was a rank uprade (from Sell to Hold, or from Hold to Buy) are
colored blue. Candles containing rank downgrades are colored black.
*/
describe_indicator('Analyst Estimates: Reports');
const ratings = await request.analyst_ratings(constants.ticker);
if (!Array.isArray(ratings)) {
throw Error("No Analyst reports for a given symbol");
}
const buys = ratings.filter(item => item.ratingCurrent == 'buy');
const sells = ratings.filter(item => item.ratingCurrent == 'sell');
const holds = ratings.filter(item => item.ratingCurrent == 'hold');
const landReportsOntoCurrentCandles = reports => land_points_onto_series(
reports.map(item => item.timestamp),
reports.map(report => [report]),
time,
'ge',
(existingReports, newReport) => [...existingReports, newReport[0]]
);
const buysLanded = landReportsOntoCurrentCandles(buys);
const sellsLanded = landReportsOntoCurrentCandles(sells);
const holdsLanded = landReportsOntoCurrentCandles(holds);
const candleColor = for_every(
buysLanded,
sellsLanded,
holdsLanded,
(b, s, h) => {
const bIsUpgrade = b && b.some(report => report.ratingPrior == 'hold' || report.ratingPrior == 'sell');
const hIsUpgrade = h && h.some(report => report.ratingPrior == 'sell');
if (bIsUpgrade || hIsUpgrade) {
return 'blue';
}
const sIsDowngrade = s && s.some(report => report.ratingPrior == 'hold' || report.ratingPrior == 'buy');
const hIsDowngrade = h && h.some(report => report.ratingPrior == 'buy');
if (sIsDowngrade || hIsDowngrade) {
return 'black';
}
}
);
color_candles(candleColor);
const buyLabels = buysLanded.map(n => n !== null ? `▲${n.length}`: null);
const sellLabels = sellsLanded.map(n => n !== null ? `▼${n.length}` : null);
paint(buyLabels, { style: 'labels_above', color: 'green', backgroundBorderRadius: 4, backgroundColor: 'green' });
paint(sellLabels, { style: 'labels_below', color: 'red', backgroundBorderRadius: 4, backgroundColor: 'red' });Automated technical analysis software. For traders, by traders.