Typical Volume by Time of Day
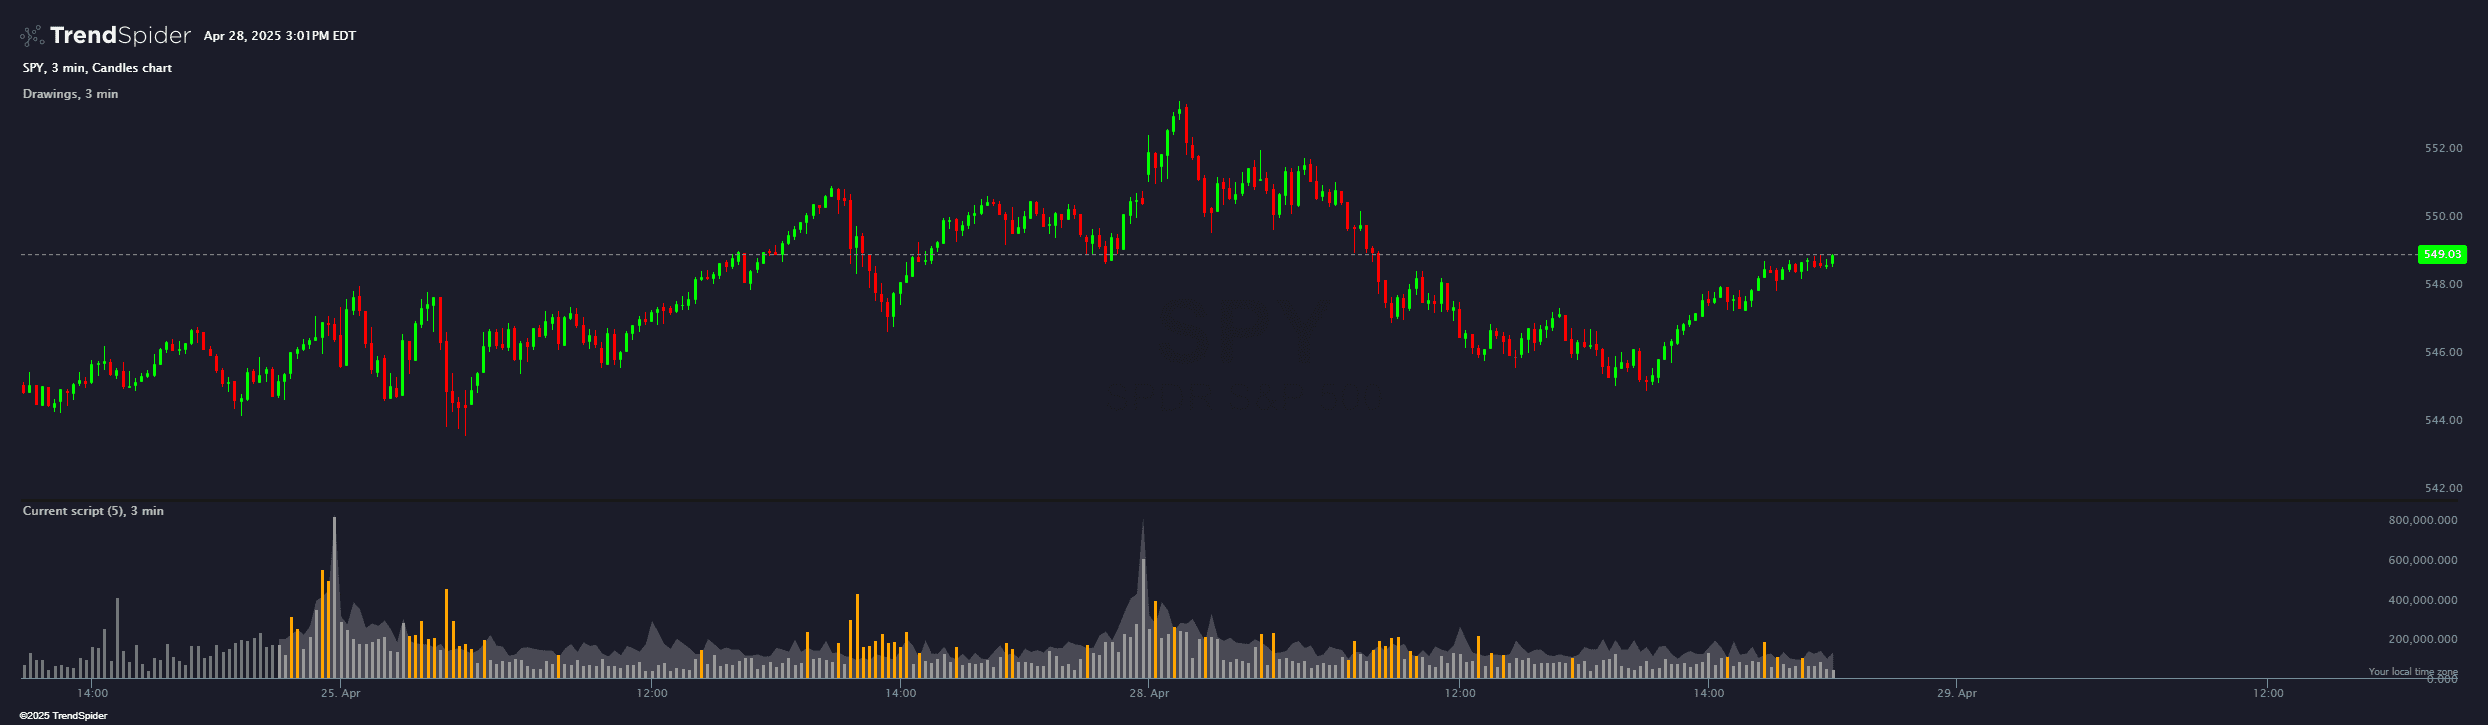
The indicator shows volume histograms, highlighting columns that are above average for a specific time on a given day. This varies from Relative Volume because it measures the volume at a specific time as opposed to RVOL which measures the most average volume over the last (x) periods. The indicator defaults to checking the last 5 days, but you can adjust this in the settings of the indicator. It is suitable for intraday charts only.
Source code
This indicator had been implemented by TrendSpider Team in JavaScript on TrendSpider. Check out the developer documentation to learn more about JS on TrendSpider.
describe_indicator('Typical Volume by Time of Day', 'lower');

if (isNaN(constants.resolution)) {
	throw Error('This indicator can only work on intraday charts');
}

const volumeByTime = {};
const lookbackPeriod = input('Lookback', 5, { min: 1, max: 10 });

const averageVolumes = for_every(volume, time, (v, t) => {
	const timeOfDay = time_of(t);
	const timeHash = `${timeOfDay.hours}:${timeOfDay.minutes}`;

	if (!volumeByTime[timeHash]) {
		volumeByTime[timeHash] = [];
	}

	const avgVolume = volumeByTime[timeHash].
		slice(-lookbackPeriod).
		reduce((result, value) => result + value, 0) / lookbackPeriod;

	volumeByTime[timeHash].push(v);

	return volumeByTime[timeHash].length >= lookbackPeriod + 1
		? avgVolume
		: null;
});

const volumeColors = for_every(close, open, averageVolumes, volume, (c, o, avg, vol) => {
	if (vol > avg) {
		return 'orange';
	}

	return '#999';
});

fill(
	paint(averageVolumes, { style: 'line', hidden: true }),
	paint(series_of(0), { style: 'line', hidden: true }),
	'#ffffff',
	0.2
);

paint(volume, { style: 'histogram', color: volumeColors });
Automated technical analysis software. For traders, by traders.