Company profile
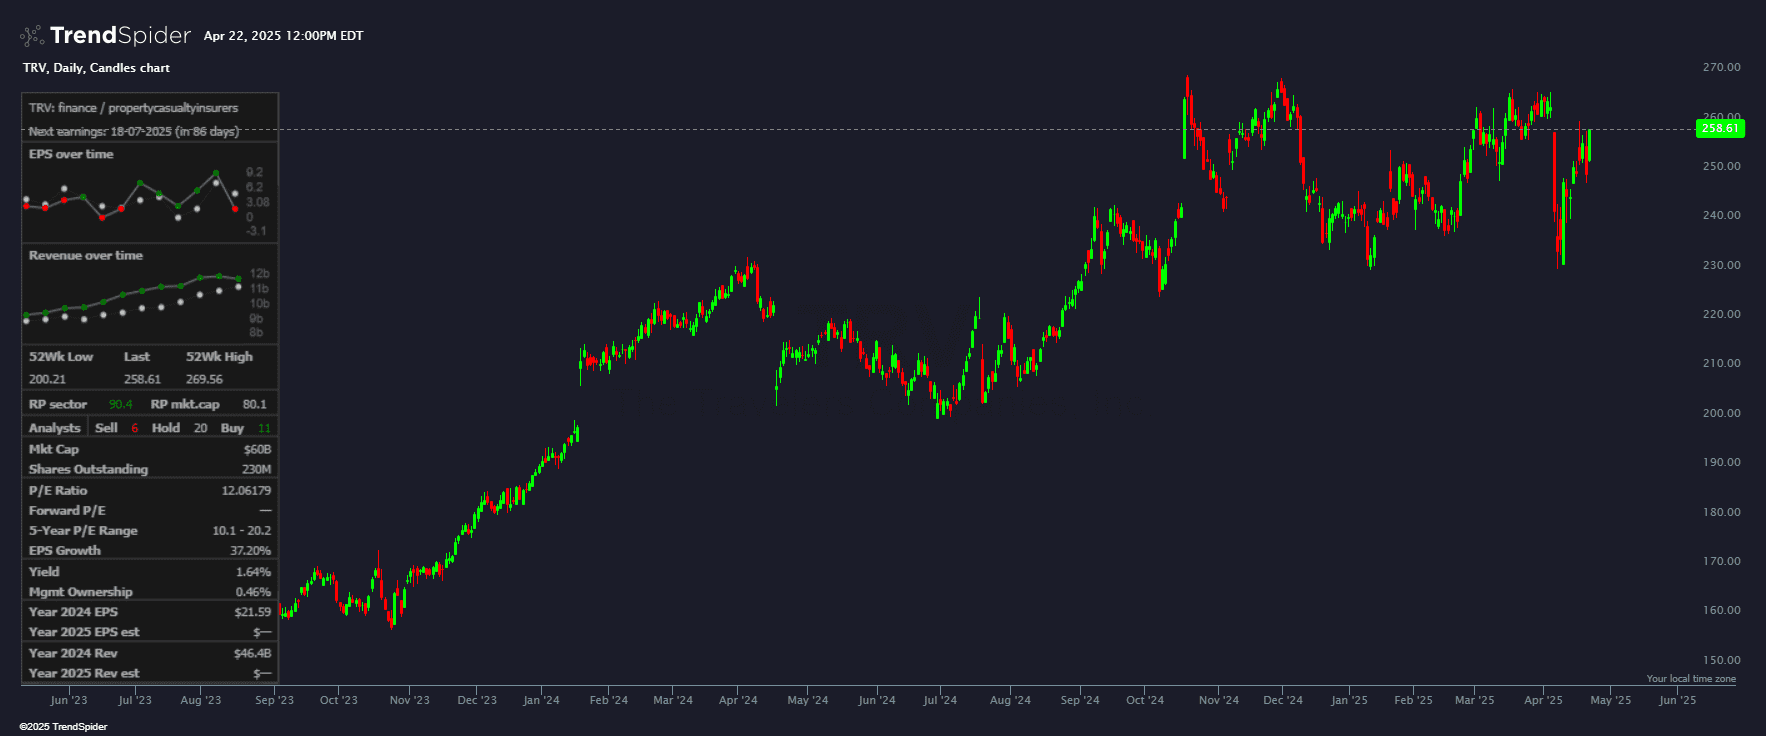
This indicator shows a companies profile as a chart overlay. This includes information like Sector, Industry, Earnings dates/values, EPS, Revenue, Relative Performance, 52 Week high/low, Analyst Estimates, P/E Ratio, Dividend Yield, Mgmt Ownership, etc.
Source code
This indicator had been implemented by TrendSpider Team in JavaScript on TrendSpider. Check out the developer documentation to learn more about JS on TrendSpider.
describe_indicator('Company profile');
const moment = library('moment-timezone');
const [weeklyHistory, fundamentals, rpSector, rpMktcap, analysts, earnings, insider] = await Promise.all([
    request.history(current.ticker, 'W'),
    request.fundamental(current.ticker, ['dividends_per_share', 'pe_ratio_ttm', 'revenue', 'eps_basic', 'market_cap', 'shares_diluted_is', 'pe_ratio_ttm'], 20),
    request.relative_performance(current.ticker, 'quarterly', 'same_sector'),
    request.relative_performance(current.ticker, 'quarterly', 'same_mktcap'),
    request.analyst_ratings(current.ticker),
    request.earnings(current.ticker, { filters: [{ field: 'timestamp', filter: 'greater', value: 0 }] }),
    request.insider_trading(current.ticker)
]);
assert(!weeklyHistory.error, `Error fetching W data: ${weeklyHistory.error}`);
assert(!fundamentals.error, `Error fetching fundamentals: ${fundamentals.error}`);
assert(!rpSector.error, `Error fetching rpSector: ${rpSector.error}`);
assert(!rpMktcap.error, `Error fetching rpMktcap: ${rpMktcap.error}`);
assert(!analysts.error, `Error fetching analysts: ${analysts.error}`);
assert(!earnings.error, `Error fetching earnings: ${earnings.error}`);
assert(!insider.error, `Error fetching insider_trading: ${insider.error}`);
const range52Wk = { high: Math.max(...weeklyHistory.high.slice(-52)), low: Math.min(...weeklyHistory.low.slice(-52)) };
const lastPrice = close[close.length - 1];
const divYield = fundamentals.dividends_per_share.slice(0, 4).reduce((result, dataPoint) => result + dataPoint.value, 0) / lastPrice;
const currentFundamental = metricId => fundamentals[metricId][0] ? fundamentals[metricId][0].value : undefined;
const lastOf = series => series[series.length - 1][1];
const headCell = text => ({ text: `${text}`, fontWeight: 'bold', color: 'var(--text-color)', padding: '1px 7px' });
const valueCell = text => ({ text: `${text}`, color: 'var(--text-color)', padding: '3px 7px' });
const rsCell = rank => ({ text: `${rank}`, color: rank > 85 ? 'green' : (rank < 50 ? 'red' : 'var(--text-color)'), padding: '3px 7px' });
const leftTitleCell = text => ({ text: `${text}`, fontWeight: 'bold', color: 'var(--text-color)', padding: '1px 7px', width: '65%' });
const rightValueCell = text => ({ text: `${text}`, color: 'var(--text-color)', textAlign: 'right', padding: '1px 7px' });
const titleValueRow = (title, value) => ({ cells: [leftTitleCell(title), rightValueCell(value)] });
const epsDataPoints = fundamentals.eps_basic.reverse().slice(-12);
const pastEPSDataPoints = [...series_of({value: null}), ...fundamentals.eps_basic].slice(-16, -4);
const epsLabels = epsDataPoints.map(record => `Q${record.quarter}'${record.year % 100}`);
const epsRange = Math.max(...epsDataPoints.map(record => record.value), ...pastEPSDataPoints.map(record => record.value)) -
    Math.min(...epsDataPoints.map(record => record.value), ...pastEPSDataPoints.map(record => record.value));
const revDataPoints = fundamentals.revenue.reverse().slice(-12);
const pastRevDataPoints = [...series_of({value: null}), ...fundamentals.revenue].slice(-16, -4);
const revLabels = revDataPoints.map(record => `Q${record.quarter}'${record.year % 100}`);
const revRange = Math.max(...revDataPoints.map(record => record.value), ...pastRevDataPoints.map(record => record.value)) -
    Math.min(...revDataPoints.map(record => record.value), ...pastRevDataPoints.map(record => record.value));
const currentRatingPerPerson = Object.fromEntries(analysts.map(record => [record.analystPerson, record.ratingCurrent]));
const currentRatingsCount = Object.keys(currentRatingPerPerson).reduce((result, person) => {
    const rating = currentRatingPerPerson[person];
    result[rating] += 1;
    return result;
}, { buy: 0, sell: 0, hold: 0 });
const formatLargeNumber = (value, decimals = 0) => isNaN(value) ? '—' : Intl.NumberFormat('en-US', { notation: "compact", maximumFractionDigits: decimals }).format(value);
const marketCap = `$${formatLargeNumber(currentFundamental('market_cap'))}`;
const sharesOutstanding = formatLargeNumber(currentFundamental('shares_diluted_is'));
const futureEarnings = earnings.filter(record => record.isFuture);
const nextFourQuartersEpsEst = futureEarnings.slice(0, 4).reduce((acc, cur) => acc + cur.eps_est, 0);
const forwardPe = nextFourQuartersEpsEst ? (close[close.length - 1] / nextFourQuartersEpsEst).toFixed(2) : '—';
const peRatioValues = fundamentals.pe_ratio_ttm.slice(0, 20).map(record => record.value);
const peRatioMax = Math.max(...peRatioValues).toFixed(1);
const peRatioMin = Math.min(...peRatioValues).toFixed(1);
const thisYearEarnings = earnings.filter(record => !record.isFuture).slice(-4).reduce((acc, cur) => acc + cur.eps, 0);
const previousYearEarnings = earnings.filter(record => !record.isFuture).slice(-8, -4).reduce((acc, cur) => acc + cur.eps, 0);
const epsGrowth = (100 * (thisYearEarnings - previousYearEarnings) / previousYearEarnings).toFixed(2);
const ownerIds = Object.keys(insider.insidersByCIK || {}).filter(id => insider.insidersByCIK[id].role.type != '10_p_owner');
const sharesInsidersOwn = ownerIds.reduce((acc, cur) => acc + insider.ownershipByCIK[cur], 0);
const mgmtOwnership = `${(100*sharesInsidersOwn/currentFundamental('shares_diluted_is')).toFixed(2)}%`;
const currentYear = time_of(time[time.length - 1]).year;
const previousYearEarningsQuarters = earnings.filter(quarter => quarter.period_year == currentYear - 1);
const previousYearEps = formatLargeNumber(previousYearEarningsQuarters.reduce((acc, cur) => acc + cur.eps, 0), 2);
const previousYearRevenue = formatLargeNumber(previousYearEarningsQuarters.reduce((acc, cur) => acc + cur.revenue, 0), 1);
const currentYearPastQuarters = earnings.filter(quarter => quarter.period_year == currentYear && !quarter.isFuture);
const currentYearFutureQuarters = earnings.filter(quarter => quarter.period_year == currentYear && quarter.isFuture);
const numberOfFutureQuartersWithoutEpsEstimate = currentYearFutureQuarters.filter(quarter => quarter.eps_est == null).length;
const currentYearPastQuartersTotalEps = currentYearPastQuarters.reduce((acc, cur) => acc + cur.eps, 0);
const currentYearFutureQuartersTotalEpsEst = currentYearFutureQuarters.reduce((acc, cur) => acc + cur.eps_est, 0);
const currentYearEpsEst = numberOfFutureQuartersWithoutEpsEstimate > 0 ? '—' : formatLargeNumber(currentYearPastQuartersTotalEps + currentYearFutureQuartersTotalEpsEst, 2);
const numberOfFutureQuartersWithoutRevenueEstimate = currentYearFutureQuarters.filter(quarter => quarter.revenue_est == null).length;
const currentYearPastQuartersTotalRevenue = currentYearPastQuarters.reduce((acc, cur) => acc + cur.revenue, 0);
const currentYearFutureQuartersTotalRevenueEst = currentYearFutureQuarters.reduce((acc, cur) => acc + cur.revenue_est, 0);
const currentYearRevenueEst = numberOfFutureQuartersWithoutRevenueEstimate > 0 ? '—' : formatLargeNumber(currentYearPastQuartersTotalRevenue + currentYearFutureQuartersTotalRevenueEst, 2);
const nextEarnings = earnings.find(record => record.isFuture);
const DAYS_IN_SECONDS = 24 * 60 * 60;
const daysUntilNextEarnings = Math.floor((nextEarnings.timestamp - time[time.length - 1]) / DAYS_IN_SECONDS);
const revenueChartDefinition = {
    width: '250px', height: '80px', type: 'line',
    options: {
        scales: {
            y: { ticks: { format: '0a', stepSize: revRange / 3, autoSkip: false }, position: 'right' },
            x: { ticks: { display: false } }
        },
        plugins: { legend: { display: false } }
    },
    data: {
        labels: revLabels,
        datasets: [{
            label: 'Rev', borderColor: 'var(--text-color)', pointBorderWidth: 0, borderWidth: 1,
            backgroundColor: revDataPoints.map((record, index) => record.value > pastRevDataPoints[index].value ? 'green' : 'red'),
            data: revDataPoints.map(record => record.value)
        }, {
            label: 'Prev.Rev', backgroundColor: 'silver', borderColor: 'var(--border-color)', pointBorderWidth: 0, borderWidth: 0.3,
            data: pastRevDataPoints.map(record => record.value)
        }]
    }
};
const epsChartDefinition = {
    width: '250px', height: '80px', type: 'line',
    options: {
        scales: {
            y: { position: 'right', ticks: { stepSize: epsRange / 3, autoSkip: false } },
            x: { ticks: { display: false } }
        },
        plugins: { legend: { display: false } }
    },
    data: {
        labels: epsLabels,
        datasets: [{
            label: 'Current EPS', borderColor: 'var(--text-color)', pointBorderWidth: 0, borderWidth: 1,
            backgroundColor: epsDataPoints.map((record, index) => record.value > pastEPSDataPoints[index].value ? 'green' : 'red'),
            data: epsDataPoints.map(record => record.value)
        }, {
            label: 'Previous year EPS', backgroundColor: 'silver', borderColor: 'var(--border-color)', pointBorderWidth: 0, borderWidth: 0.3,
            data: pastEPSDataPoints.map(record => record.value)
        }]
    }
};
const SEPARATOR = { text: "", colspan: 2, borderBottom: '1px solid var(--border-color)' };
paint_overlay('Table', { position: 'bottom_left', order: 'above_all' }, {
    fontSize: 12,
    border: '1px solid var(--border-color)',
    background: 'var(--background-color)',
    rows: [{
        cells: [{ colspan: 2, text: `${current.ticker}: ${current.sector} / ${current.industry}`, color: 'var(--text-color)', padding: '3px 7px' }]
    }, {
        cells: [{ ...valueCell(`Next earnings: ${moment(nextEarnings.timestamp * 1e3).format('DD-MM-YYYY')} (in ${daysUntilNextEarnings} days)`), colspan: 2 }]
    }, {
        cells: [SEPARATOR]
    }, {
        cells: [{ ...headCell("EPS over time"), colspan: 2 }]
    }, {
        cells: [{ colspan: 2, chart: epsChartDefinition }]
    }, {
        cells: [SEPARATOR]
    }, {
        cells: [{ ...headCell("Revenue over time"), colspan: 2 }]
    }, {
        cells: [{ colspan: 2, chart: revenueChartDefinition }]
    }, {
        cells: [SEPARATOR]
    }, {
        cells: [{
            colspan: 2,
            table: {
                width: '100%',
                rows: [{
                    cells: [headCell("52Wk Low"), headCell("Last"), headCell("52Wk High")]
                }, {
                    cells: [valueCell(range52Wk.low.toFixed(current.decimals)), valueCell(lastPrice.toFixed(current.decimals)), valueCell(range52Wk.high.toFixed(current.decimals))]
                }, {
                    cells: [{ ...SEPARATOR, colspan: 3 }]
                }]
            }
        }]
    }, {
        cells: [{
            colspan: 2,
            table: {
                width: '100%',
                rows: [{
                    cells: [headCell("RP sector"), rsCell(lastOf(rpSector).toFixed(1)), headCell("RP mkt.cap"), rsCell(lastOf(rpMktcap).toFixed(1))]
                }, {
                    cells: [{ ...SEPARATOR, colspan: 4 }]
                }]
            }
        }]
    }, {
        cells: [{
            colspan: 2,
            table: {
                width: '100%',
                rows: [{
                    cells: [{
                        ...headCell("Analysts"),
                        borderRight: '1px solid var(--border-color)'
                    }, {
                        table: {
                            rows: [{
                                cells: [
                                    leftTitleCell("Sell"), { ...rightValueCell(currentRatingsCount.sell), color: 'red' },
                                    leftTitleCell("Hold"), rightValueCell(currentRatingsCount.hold),
                                    leftTitleCell("Buy"), { ...rightValueCell(currentRatingsCount.buy), color: 'green' },
                                ]
                            }]
                        }
                    }]
                }, {
                    cells: [SEPARATOR]
                }]
            }
        }]
    }, {
        cells: [{
            colspan: 2,
            table: {
                width: '100%',
                rows: [
                    titleValueRow("Mkt Cap", marketCap),
                    titleValueRow("Shares Outstanding", sharesOutstanding),
                    { cells: [SEPARATOR] },
                    titleValueRow("P/E Ratio", currentFundamental('pe_ratio_ttm')),
                    titleValueRow("Forward P/E", forwardPe),
                    titleValueRow("5-Year P/E Range", `${peRatioMin} - ${peRatioMax}`),
                    titleValueRow("EPS Growth", `${epsGrowth}%`),
                    { cells: [SEPARATOR] },
                    titleValueRow("Yield", `${(100 * divYield).toFixed(2)}%`),
                    titleValueRow("Mgmt Ownership", mgmtOwnership),
                    { cells: [SEPARATOR] },
                    titleValueRow(`Year ${currentYear - 1} EPS`, `$${previousYearEps}`),
                    titleValueRow(`Year ${currentYear} EPS est`, `$${currentYearEpsEst}`),
                    { cells: [SEPARATOR] },
                    titleValueRow(`Year ${currentYear - 1} Rev`, `$${previousYearRevenue}`),
                    titleValueRow(`Year ${currentYear} Rev est`, `$${currentYearRevenueEst}`),
                    { cells: [SEPARATOR] }
                ]
            }
        }]
    }]
});
Automated technical analysis software. For traders, by traders.