MA Slope Strategy
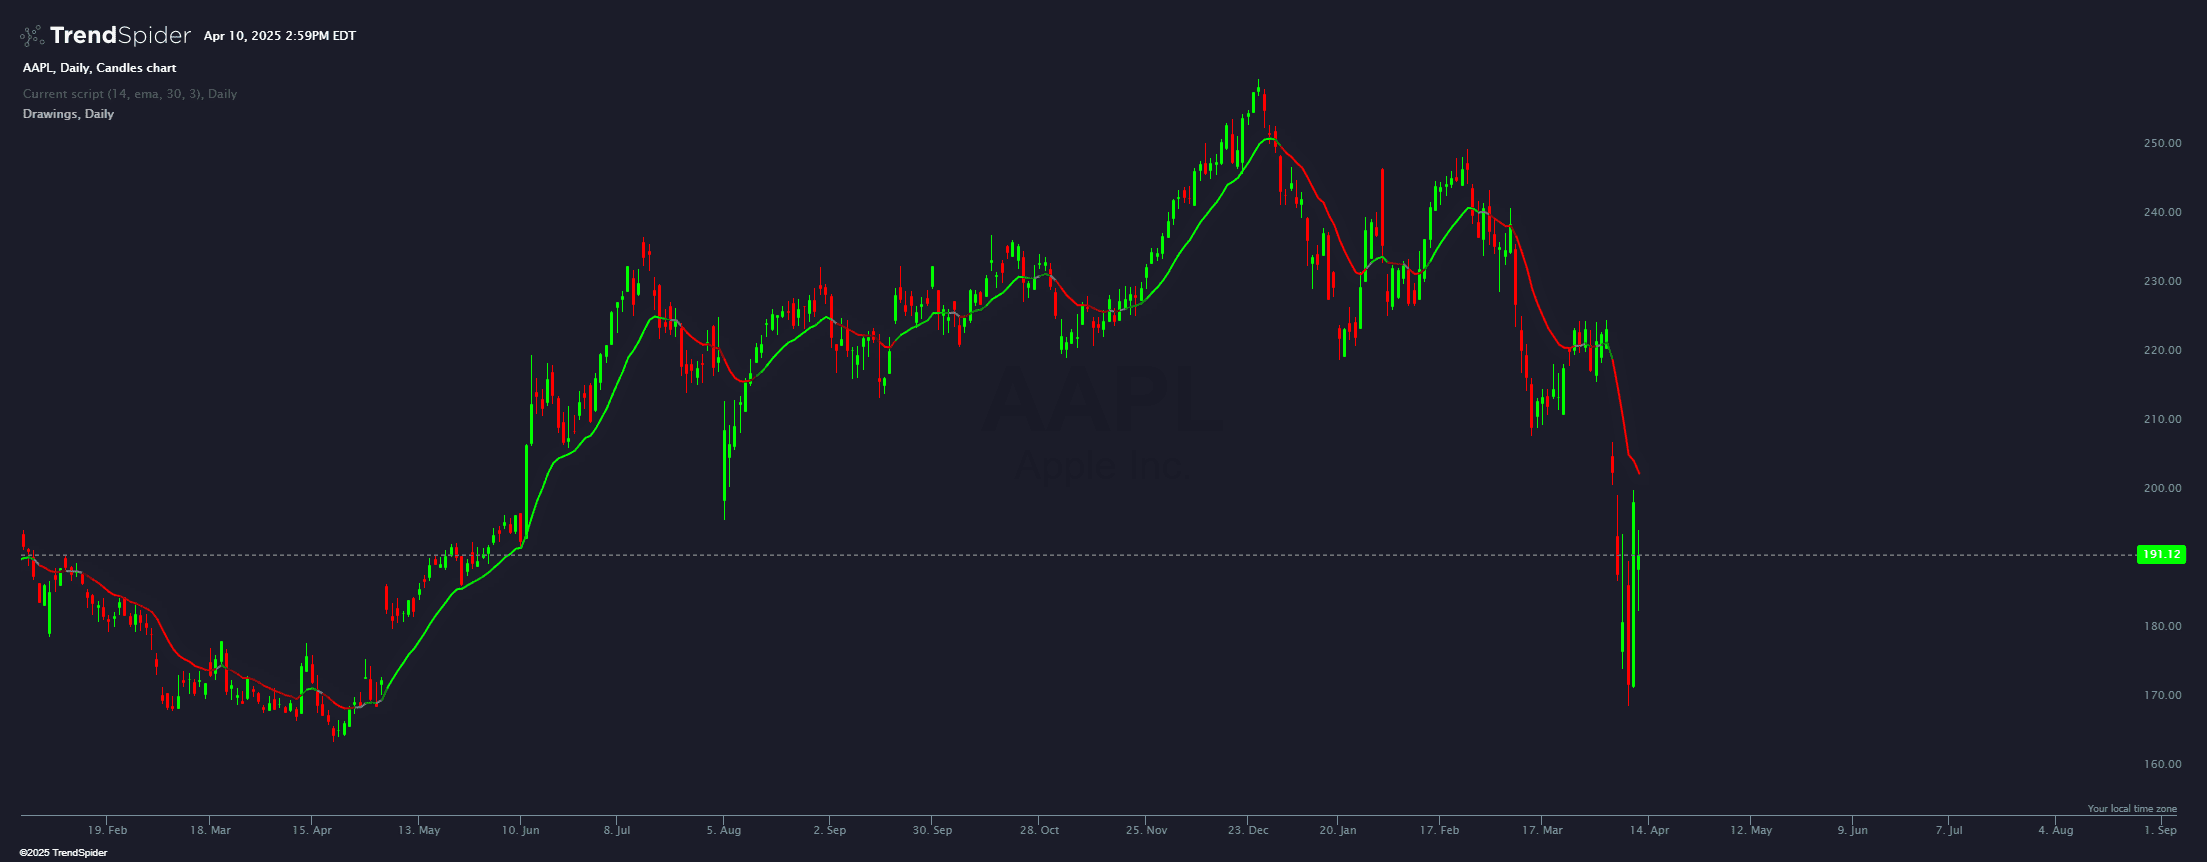
The "Moving Average Slope Strategy with Gradient Colors" is a technical indicator that calculates a moving average (defaulting to an 8-period EMA) on price data, determines its slope in degrees, and visually represents the slope's direction and intensity through a color gradient—green for upward slopes and red for downward slopes. The color intensity adjusts based on how steep the slope is relative to a customizable degree threshold (default 45°), with sharper slopes showing stronger colors. It also generates signals ("Slope Up" or "Slope Down") when the slope exceeds the threshold, aiding in trend identification for informational purposes.
Source code
This indicator had been implemented by TrendSpider Team in JavaScript on TrendSpider. Check out the developer documentation to learn more about JS on TrendSpider.
// This indicator was generated using AI. It has not been quality assured and should be used for informational purposes only.
describe_indicator('MA Slope Strategy', 'price');

// Input parameters for the indicator
const maLength = input.number('MA Length', 14, { min: 2, max: 100 });
const maType = input('MA Type', 'ema', constants.ma_types);
const degreeThreshold = input.number('Degree Threshold', 30, { min: 1, max: 90 });
const slopeSmoothing = input.number('Slope Smoothing', 3, { min: 1, max: 10 });

// Helper to compute the selected moving average type
function computeMA(type, data, length) {
    if (type === 'ema') return ema(data, length);
    if (type === 'sma') return sma(data, length);
    if (type === 'wma') return wma(data, length);
    if (type === 'hullma') return hullma(data, length);
    if (type === 'twap') return twap(data, length);
    if (type === 'alma') return alma(data, length);
    if (type === 'kama') return kama(data, length);
    if (type === 'vwma') return vwma(data, length);
    if (type === 'wildma') return wildma(data, length);
    return ema(data, length); // Default to EMA if none selected
}

// Calculate the moving average
const ma = computeMA(maType, close, maLength);

// Calculate the slope of the moving average (difference in value over 1 candle)
const rawSlope = for_every(ma, shift(ma, 1), (current, previous) => (current - previous) / 1);
const smoothedSlope = ema(rawSlope, slopeSmoothing);

// Convert smoothed slope to degrees
const slopeInDegrees = smoothedSlope.map(slopeVal => Math.atan(slopeVal) * (180 / Math.PI));

// Paint the moving average line with dynamic colors based on the slope degree
const maColors = slopeInDegrees.map(degree => {
    const absDegree = Math.abs(degree);
    if (absDegree < 5) return 'gray'; // Neutral zone for very flat slopes
    if (degree > 0) {
        const greenIntensity = Math.min(255, Math.round((absDegree / degreeThreshold) * 200) + 55);
        return `rgba(0, ${greenIntensity}, 0, 1)`; // Green shades
    } else {
        const redIntensity = Math.min(255, Math.round((absDegree / degreeThreshold) * 200) + 55);
        return `rgba(${redIntensity}, 0, 0, 1)`; // Red shades
    }
});

// Paint the moving average line with varying colors
paint(ma, { name: 'Enhanced MA with Slope Colors', color: maColors, thickness: 2 });

// Register individual signals for each color state
const graySignal = slopeInDegrees.map(degree => Math.abs(degree) < 5 ? true : false);
const greenSignal = slopeInDegrees.map(degree => degree > 0 && Math.abs(degree) >= 5 ? true : false);
const redSignal = slopeInDegrees.map(degree => degree < 0 && Math.abs(degree) >= 5 ? true : false);

// Register each signal separately for use in Visual Scripts
register_signal(graySignal, 'MA Slope Flat');
register_signal(greenSignal, 'MA Slope Up');
register_signal(redSignal, 'MA Slope Down');