Multi-Timeframe Bull/Bear Recommendation Table Example
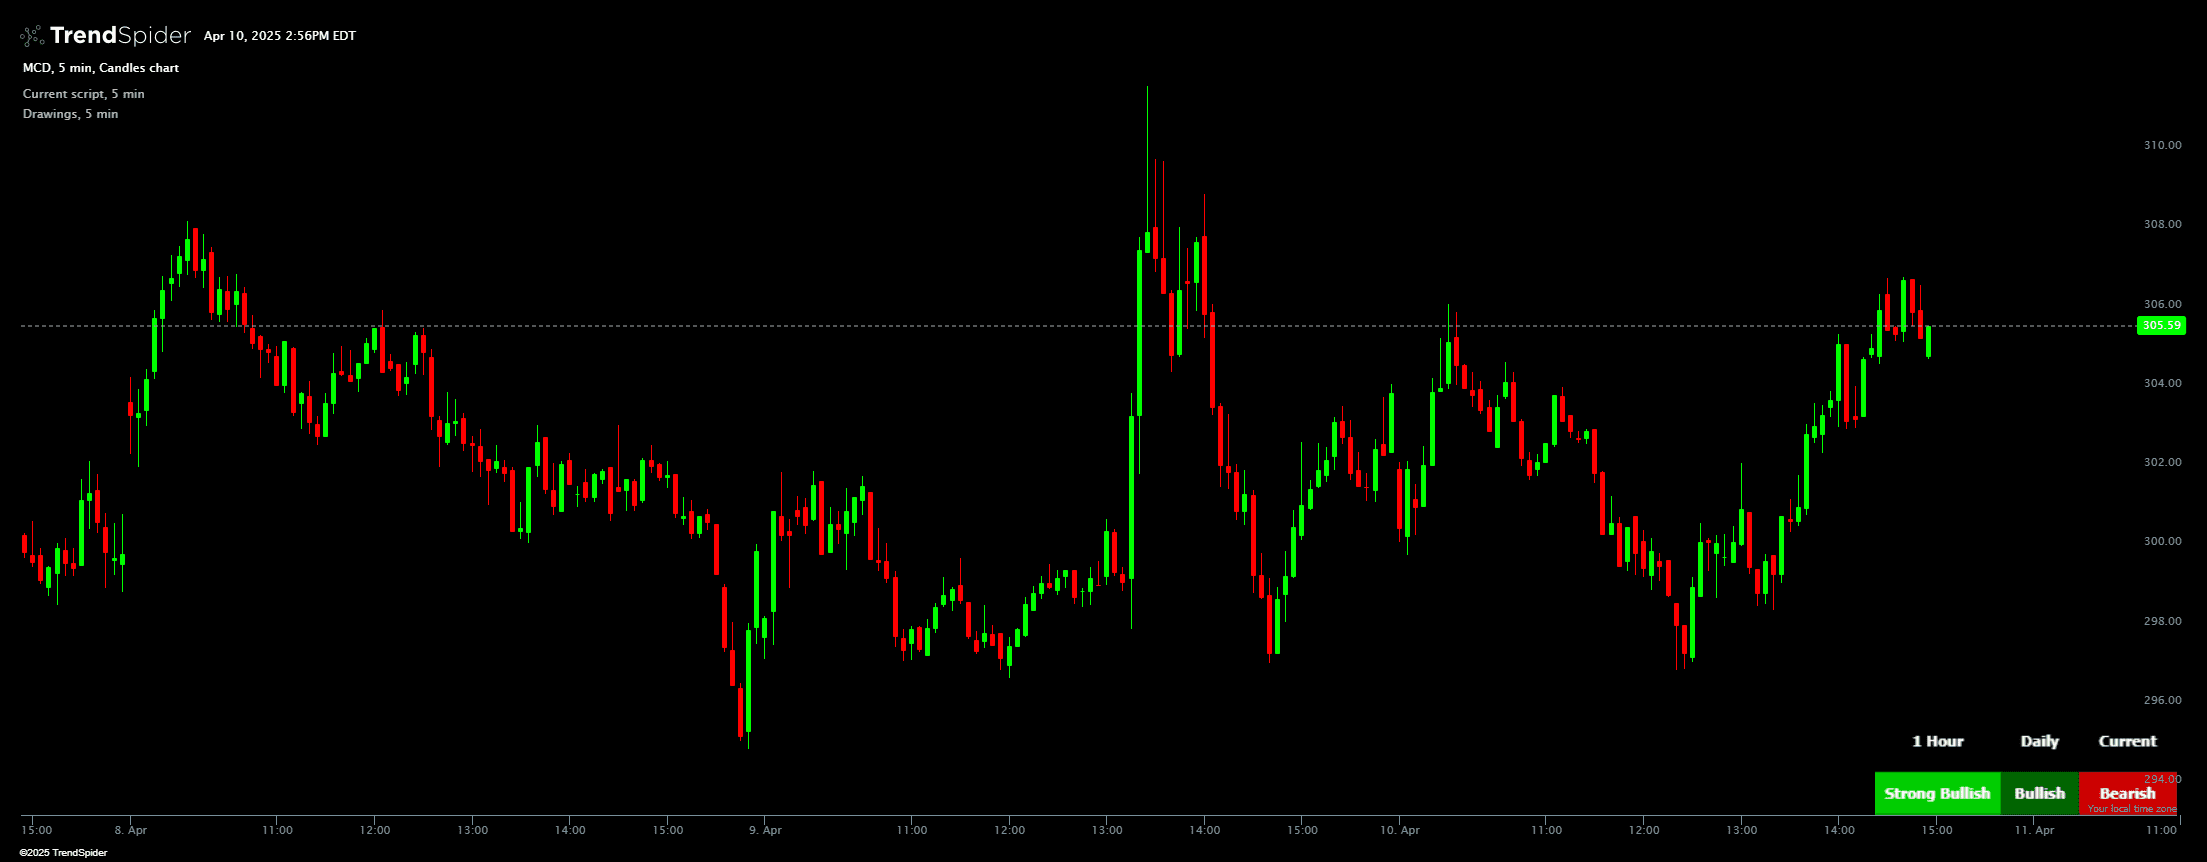
The "Multi-Timeframe Bull/Bear Recommendation Table Example" indicator evaluates market bias across three timeframes—1-hour, daily, and the current chart timeframe—by comparing the latest closing price to a 5-period and a 21-period EMA on each timeframe, determining a recommendation of "Strong Bullish," "Bullish," "Neutral," "Bearish," or "Strong Bearish" based on the price's position relative to both EMAs. It assigns a color-coded label to each recommendation (bright green for Strong Bullish, dark green for Bullish, grey for Neutral, red for Bearish, and bright red for Strong Bearish) and displays these recommendations in a table positioned at the bottom-right of the chart overlay. The table includes a header row labeling the timeframes ("1 Hour," "Daily," "Current") and a recommendation row showing the corresponding bias for each timeframe with color-coded backgrounds for visual clarity.
Source code
This indicator had been implemented by TrendSpider Team in JavaScript on TrendSpider. Check out the developer documentation to learn more about JS on TrendSpider.
describe_indicator('Multi-Timeframe Bull/Bear Recommendation Table Example', 'price');

// Inputs for EMA lengths
const emaShortLength = 5;
const emaLongLength = 21;

// Define timeframes for the analysis
const timeframe1 = '60'; // 1 Hour
const timeframe2 = 'D';  // Daily
const timeframe3 = current.resolution; // Current chart timeframe

// Fetch data for each timeframe
const dataTimeframe1 = await request.history(constants.ticker, timeframe1);
const dataTimeframe2 = await request.history(constants.ticker, timeframe2);
const dataTimeframe3 = { close, time }; // Use current timeframe data

// Calculate EMA values and recommendations for a given timeframe
function calculateRecommendation(data) {
    const shortEMA = ema(data.close, emaShortLength);
    const longEMA = ema(data.close, emaLongLength);
    const latestClose = data.close[data.close.length - 1];
    if (latestClose > shortEMA[shortEMA.length - 1] && latestClose > longEMA[longEMA.length - 1]) {
        return { label: 'Strong Bullish', color: 'rgba(0, 255, 0, 0.8)' }; // Bright green for Strong Bullish
    } else if (latestClose > shortEMA[shortEMA.length - 1] && latestClose < longEMA[longEMA.length - 1]) {
        return { label: 'Bullish', color: 'rgba(0, 128, 0, 0.8)' }; // Dark green for Bullish
    } else if (latestClose < shortEMA[shortEMA.length - 1] && latestClose > longEMA[longEMA.length - 1]) {
        return { label: 'Bearish', color: 'rgba(255, 0, 0, 0.8)' }; // Red for Bearish
    } else if (latestClose < shortEMA[shortEMA.length - 1] && latestClose < longEMA[longEMA.length - 1]) {
        return { label: 'Strong Bearish', color: 'rgba(255, 69, 0, 0.8)' }; // Bright red for Strong Bearish
    } else {
        return { label: 'Neutral', color: 'rgba(128, 128, 128, 0.8)' }; // Grey for Neutral
    }
}

// Calculate recommendations for all timeframes
const recommendation1 = calculateRecommendation(dataTimeframe1);
const recommendation2 = calculateRecommendation(dataTimeframe2);
const recommendation3 = calculateRecommendation(dataTimeframe3);

// Paint the table on the chart overlay
paint_overlay('Multi-Timeframe Recommendation Table', { position: 'bottom_right' }, {
    rows: [
        { // Header Row
            cells: [
                { text: '1 Hour', fontSize: '15px', fontWeight: 'bold', textAlign: 'center', color: 'white', padding: '20px' },
                { text: 'Daily', fontSize: '15px', fontWeight: 'bold', textAlign: 'center', color: 'white', padding: '20px' },
                { text: 'Current', fontSize: '15px', fontWeight: 'bold', textAlign: 'center', color: 'white', padding: '20px' }
            ]
        },
        { // Recommendation Row
            cells: [
                {
                    text: recommendation1.label,
                    fontSize: '15px',
                    fontWeight: 'bold',
                    textAlign: 'center',
                    color: 'white',
                    backgroundColor: recommendation1.color,
                    padding: '10px'
                },
                {
                    text: recommendation2.label,
                    fontSize: '15px',
                    fontWeight: 'bold',
                    textAlign: 'center',
                    color: 'white',
                    backgroundColor: recommendation2.color,
                    padding: '10px'
                },
                {
                    text: recommendation3.label,
                    fontSize: '15px',
                    fontWeight: 'bold',
                    textAlign: 'center',
                    color: 'white',
                    backgroundColor: recommendation3.color,
                    padding: '10px'
                }
            ]
        }
    ]
});