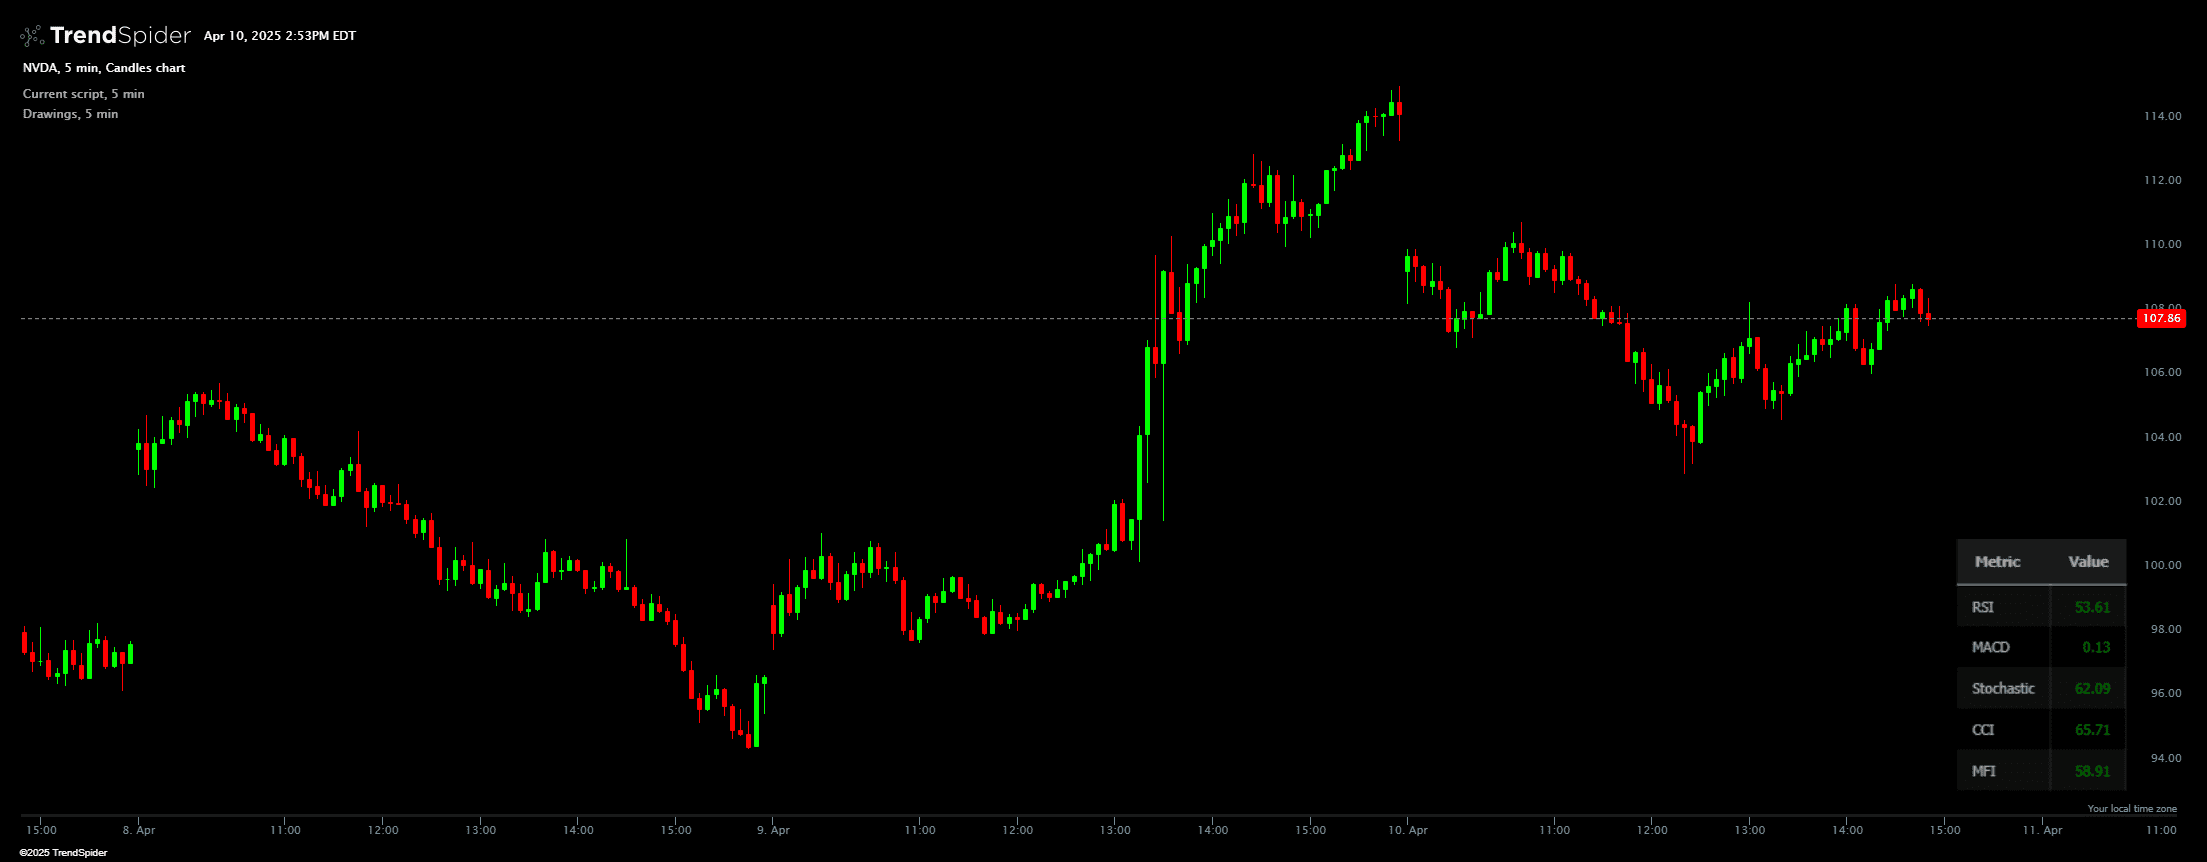
Momentum Metrics Table

This indicator paints a chart overlay that shows the current readings for 5 popular momentum metrics. RSI, MACD, Stochastic, CCI, and MFI. The indicator also colors the value based on whether it has increased or decreased.
Source code
This indicator had been implemented by TrendSpider Team in JavaScript on TrendSpider. Check out the developer documentation to learn more about JS on TrendSpider.
describe_indicator('Momentum Metrics Table');

// Define the momentum metrics to calculate
const metrics = [
    { name: 'RSI', func: (data) => rsi(data, 14) },
    { name: 'MACD', func: (data) => {
        const macd = sub(ema(data, 12), ema(data, 26));
        const signal = ema(macd, 9);
        return sub(macd, signal);
    }},
    { name: 'Stochastic', func: () => stochastic(close, high, low, 14) },
    { name: 'CCI', func: () => cci(hlc3, 20) },
    { name: 'MFI', func: () => mfi(hlc3, volume, 14) }
];

// Calculate the metrics
const results = metrics.map(metric => ({
    name: metric.name,
    value: metric.name === 'Stochastic' || metric.name === 'CCI' || metric.name === 'MFI'
        ? metric.func()[metric.func().length - 1]
        : metric.func(close)[metric.func(close).length - 1]
}));

// Define thresholds for bullish/bearish conditions
const thresholds = {
    RSI: { bullish: 50, bearish: 50 },
    MACD: { bullish: 0, bearish: 0 },
    Stochastic: { bullish: 50, bearish: 50 },
    CCI: { bullish: 0, bearish: 0 },
    MFI: { bullish: 50, bearish: 50 }
};

// Create the table rows (now columns)
const tableCells = results.map((result, index) => [
    // **Left Transparent Column**
    {
        text: '',
        padding: '10px 25px', // Creates space to push the table right
        backgroundColor: 'transparent',
        borderRight: 'none'
    },
    {
        text: result.name,
        padding: '10px 15px',
        color: 'var(--text-color)',
        backgroundColor: index % 2 === 0 ? 'rgba(255, 255, 255, 0.05)' : 'transparent',
        borderRight: '1px solid rgba(255, 255, 255, 0.1)'
    },
    {
        text: result.value.toFixed(2),
        color: result.value > thresholds[result.name].bullish ? 'green' :
               result.value < thresholds[result.name].bearish ? 'red' : 'var(--text-color)',
        padding: '10px 15px',
        backgroundColor: index % 2 === 0 ? 'rgba(255, 255, 255, 0.05)' : 'transparent',
        borderRight: '1px solid rgba(255, 255, 255, 0.1)',
        textAlign: 'right'
    },
    // **Right Transparent Column**
    {
        text: '',
        padding: '10px 25px', // Pushes content further left
        backgroundColor: 'transparent',
        borderRight: 'none'
    }
]);

// Paint the overlay with the table
paint_overlay('Momentum Metrics', { position: 'bottom_right' }, {
    rows: [
        {
            cells: [
                // **Left Transparent Header Column**
                {
                    text: '',
                    padding: '12px 25px',
                    backgroundColor: 'transparent'
                },
                {
                    text: 'Metric',
                    color: 'var(--text-color)',
                    padding: '12px 18px',
                    fontWeight: 'bold',
                    borderBottom: '2px solid var(--text-color)',
                    backgroundColor: 'rgba(255, 255, 255, 0.1)'
                },
                {
                    text: 'Value',
                    color: 'var(--text-color)',
                    padding: '12px 18px',
                    fontWeight: 'bold',
                    borderBottom: '2px solid var(--text-color)',
                    backgroundColor: 'rgba(255, 255, 255, 0.1)',
                    textAlign: 'right'
                },
                // **Right Transparent Header Column**
                {
                    text: '',
                    padding: '12px 25px',
                    backgroundColor: 'transparent'
                }
            ]
        },
        ...tableCells.map(cell => ({ cells: cell })),
        // **Bottom Spacer Row**
        {
            cells: [
                {
                    text: '',
                    padding: '12px 0',
                    borderRight: 'none'
                },
                {
                    text: '',
                    padding: '12px 0',
                    borderRight: 'none'
                },
                {
                    text: '',
                    padding: '12px 25px',
                    backgroundColor: 'transparent'
                },
                {
                    text: '',
                    padding: '12px 25px',
                    backgroundColor: 'transparent'
                }
            ]
        }
    ],
    style: {
        border: '2px solid var(--text-color)',
        borderRadius: '6px',
        margin: '50px 80px 50px 50px', // Adjusted margin for better positioning
        overflow: 'hidden',
        display: 'inline-block'
    }
});
