Opening Range Breakout Strategy with ATR
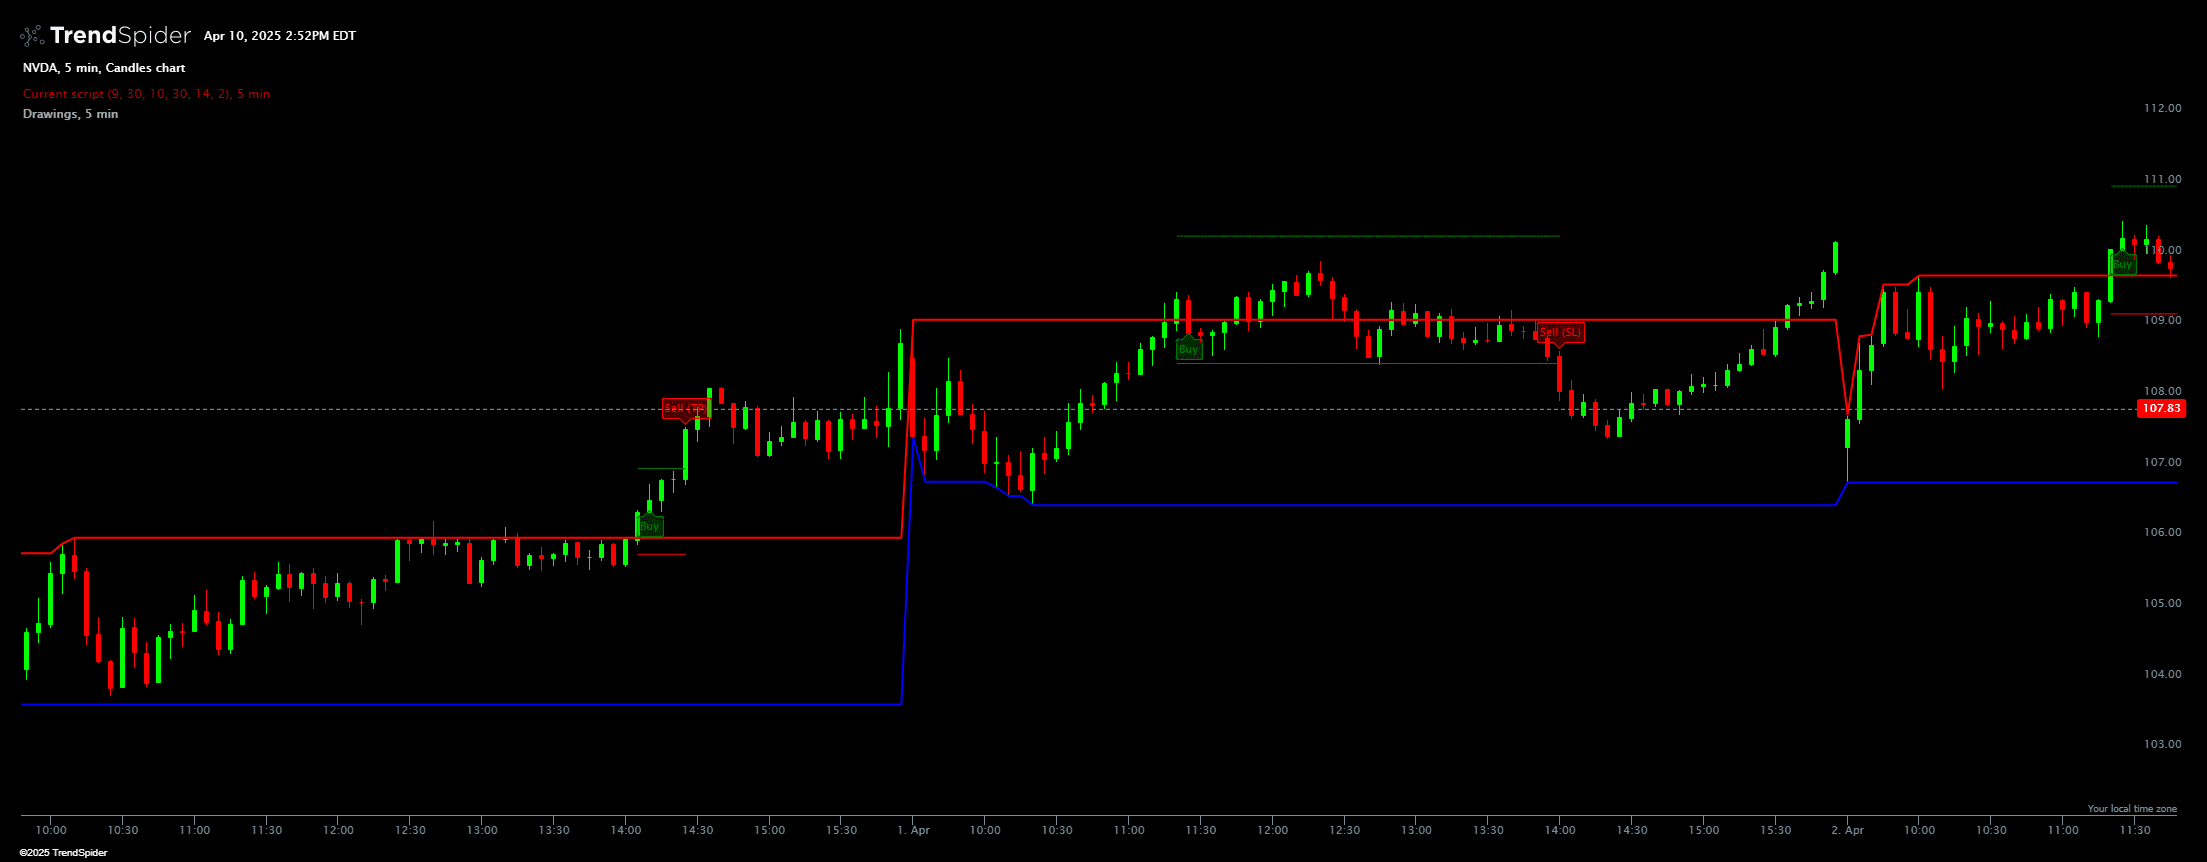
This indicator paints buy and sell labels on the chart. When price breaks out from the opening range high, a buy label is painted. Once a buy label is painted, a take profit and stop loss are painted as horizontal lines. Once price violates either line, a Sell label is painted. This labels can be referenced in visual scripting (strategy tester, scanner, alerts, bots, smart checklist)
Source code
This indicator had been implemented by TrendSpider Team in JavaScript on TrendSpider. Check out the developer documentation to learn more about JS on TrendSpider.
// This indicator was generated by AI and has not passed any formal QA process at TrendSpider. Use for informational purposes only.

describe_indicator('Opening Range Breakout Strategy with ATR', 'price');

// Input for Opening Range Time Selection
const startHour = input.number('Start Hour', 9, { min: 0, max: 23 });
const startMinute = input.number('Start Minute', 30, { min: 0, max: 59 });
const endHour = input.number('End Hour', 10, { min: 0, max: 23 });
const endMinute = input.number('End Minute', 30, { min: 0, max: 59 });

// Inputs for ATR settings
const atrLength = input.number('ATR Length', 14, { min: 1, max: 50 });
const atrMultiplier = input.number('ATR Multiplier', 2, { min: 0.5, max: 10, step: 0.1 });

// Time limits for entering trades
const tradeStartHour = 10;
const tradeStartMinute = 30;
const tradeEndHour = 15;
const tradeEndMinute = 30;

// Calculate ATR for Stop Loss/Take Profit
const atrValues = atr(close, high, low, atrLength);

// Variables to keep track of positions
let inTrade = false;
let entryPrice = 0;
let stopLossLevel = 0;
let takeProfitLevel = 0;

// Series for buy/sell labels and painting the stop loss/take profit lines
const buyLabels = series_of(null);
const sellLabels = series_of(null);
let stopLossLine = series_of(null);
let takeProfitLine = series_of(null);

// Function to calculate opening range high and low
function getOpeningRangeHighLow() {
    const openingRangeHighs = series_of(null);
    const openingRangeLows = series_of(null);
    let currentDay = null;
    let openingRangeHigh = -Infinity;
    let openingRangeLow = Infinity;

    for (let i = 0; i < time.length; i++) {
        const date = time_of(time[i]);
        const day = date.dayOfYear;

        if (day !== currentDay) {
            currentDay = day;
            openingRangeHigh = -Infinity;
            openingRangeLow = Infinity;
        }

        // Check if the current time is within the user-defined range
        if (
            (date.hours > startHour || (date.hours === startHour && date.minutes >= startMinute)) &&
            (date.hours < endHour || (date.hours === endHour && date.minutes <= endMinute))
        ) {
            if (high[i] > openingRangeHigh) {
                openingRangeHigh = high[i];
            }
            if (low[i] < openingRangeLow) {
                openingRangeLow = low[i];
            }
        }

        openingRangeHighs[i] = openingRangeHigh;
        openingRangeLows[i] = openingRangeLow;
    }
    return { openingRangeHighs, openingRangeLows };
}

// Get the opening range high and low series
const { openingRangeHighs, openingRangeLows } = getOpeningRangeHighLow();

// Paint the opening range high and low lines
paint(openingRangeHighs, { style: 'line', color: 'red', thickness: 2, name: 'Opening Range High' });
paint(openingRangeLows, { style: 'line', color: 'blue', thickness: 2, name: 'Opening Range Low' });

// Strategy loop
for (let i = atrLength; i < close.length; i++) {
    const date = time_of(time[i]);

    // Check if it's within the allowed trading time window (10:30 to 15:30)
    const isInTradingWindow =
        (date.hours > tradeStartHour || (date.hours === tradeStartHour && date.minutes >= tradeStartMinute)) &&
        (date.hours < tradeEndHour || (date.hours === tradeEndHour && date.minutes <= tradeEndMinute));

    // Buy signal: when price crosses above the opening range high during the trade window
    if (!inTrade && isInTradingWindow && close[i - 1] < openingRangeHighs[i - 1] && close[i] > openingRangeHighs[i]) {
        inTrade = true;
        entryPrice = open[i + 1];  // Set the entry price at the open of the next candle

        // Calculate stop loss and take profit based on ATR
        const atrValue = atrValues[i];
        stopLossLevel = entryPrice - (atrMultiplier * atrValue);
        takeProfitLevel = entryPrice + (atrMultiplier * atrValue);

        // Paint the buy label and store the entry price
        buyLabels[i + 1] = 'Buy';

        // Paint stop loss and take profit lines
        stopLossLine[i + 1] = stopLossLevel;
        takeProfitLine[i + 1] = takeProfitLevel;
    }

    // If in trade, check if price hits stop loss or take profit
    if (inTrade) {
        // Check for stop loss hit
        if (close[i] <= stopLossLevel) {
            inTrade = false;  // Exit trade
            sellLabels[i] = 'Sell (SL)';  // Paint sell label for stop loss
        }

        // Check for take profit hit
        if (close[i] >= takeProfitLevel) {
            inTrade = false;  // Exit trade
            sellLabels[i] = 'Sell (TP)';  // Paint sell label for take profit
        }

        // Continue painting the stop loss and take profit lines
        stopLossLine[i] = stopLossLevel;
        takeProfitLine[i] = takeProfitLevel;
    }
}

// Paint the Stop Loss and Take Profit lines
paint(stopLossLine, { name: 'Stop Loss', color: 'red', style: 'line', thickness: 1 });
paint(takeProfitLine, { name: 'Take Profit', color: 'green', style: 'line', thickness: 1 });

// Paint the Buy and Sell labels
paint(buyLabels, { style: 'labels_below', backgroundColor: 'green', color: 'green' });
paint(sellLabels, { style: 'labels_above', backgroundColor: 'red', color: 'red' });

// Register signals for use in visual scripting
register_signal(buyLabels, 'Buy');
register_signal(sellLabels, 'Sell');
Automated technical analysis software. For traders, by traders.