CCI & ATR Strategy
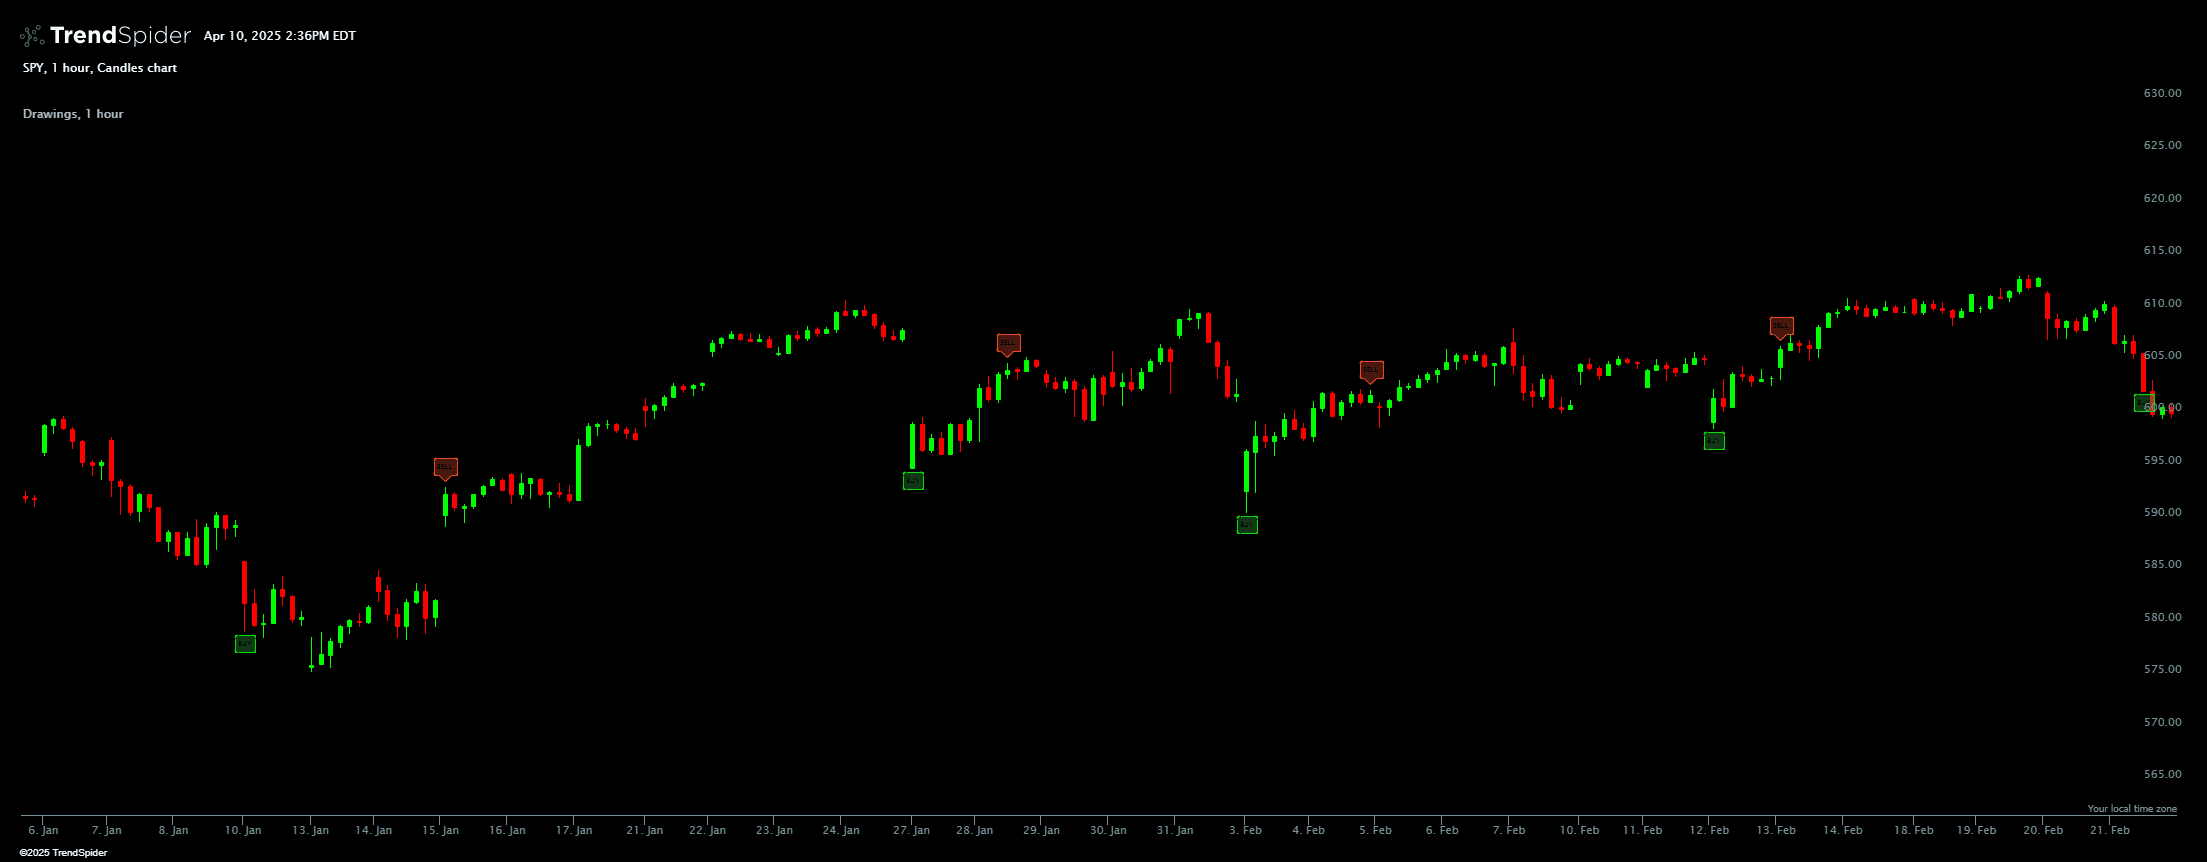
The indicator now calculates the CCI with a default period of 14 and triggers a "Buy" signal when the CCI drops below -200, painting a green "BUY" label below the candle.
Once in a position, it exits with a "Sell" signal when the price moves more than 1.5 times the 14-period ATR away from the entry price, painting a red "SELL" label above the candle.
The signals are registered for use in visual scripting, allowing integration with automated strategies or alerts.
Source code
This indicator had been implemented by TrendSpider Team in JavaScript on TrendSpider. Check out the developer documentation to learn more about JS on TrendSpider.
// This indicator was made by AI and has not been QA checked by the TrendSpider development team. The indicator is for entertainment purposes only.

describe_indicator('CCI & ATR Strategy', 'price', { shortName: 'CCI_ATR_Strategy' });

// Inputs
const cciLength = input('CCI Length', 14, { min: 1, max: 50 });
const atrLength = input('ATR Length', 14, { min: 1, max: 50 });
const atrMultiplier = input('ATR Multiplier', 2, { min: 0.1, max: 10 });

// Calculate CCI
const cciValues = cci(close, cciLength);

// Calculate ATR
const atrValues = atr(atrLength);

// Buy signal: CCI goes below -200
const buySignal = cciValues.map(val => val < -200);

// Sell signal: Price moves more than 1.5x ATR from the buy price
let inPosition = false;
let entryPrice = 0;
const buySellSignals = series_of(null);

for (let i = 1; i < close.length; i++) {
    if (buySignal[i] && !inPosition) {
        buySellSignals[i] = 'BUY';
        entryPrice = close[i];
        inPosition = true;
    } else if (inPosition) {
        const priceChange = Math.abs(close[i] - entryPrice);
        if (priceChange > atrValues[i] * atrMultiplier) {
            buySellSignals[i] = 'SELL';
            inPosition = false;
        }
    }
}

// Paint buy/sell labels
const buyLabels = buySellSignals.map(signal => signal === 'BUY' ? 'BUY' : null);
const sellLabels = buySellSignals.map(signal => signal === 'SELL' ? 'SELL' : null);

paint(buyLabels, {
    style: 'labels_below',
    color: 'black',
    backgroundColor: '#0ADD08',
    fontSize: 7,
    backgroundBorderRadius: 3,
    verticalOffset: 3
});

paint(sellLabels, {
    style: 'labels_above',
    color: 'black',
    backgroundColor: '#EE4B2B',
    fontSize: 7,
    backgroundBorderRadius: 3,
    verticalOffset: 3
});

// Register signals for visual scripting
const buySignalSeries = buySellSignals.map(signal => signal === 'BUY');
const sellSignalSeries = buySellSignals.map(signal => signal === 'SELL');

register_signal(buySignalSeries, 'Buy Signal');
register_signal(sellSignalSeries, 'Sell Signal');
Automated technical analysis software. For traders, by traders.