MA Distance% from Close
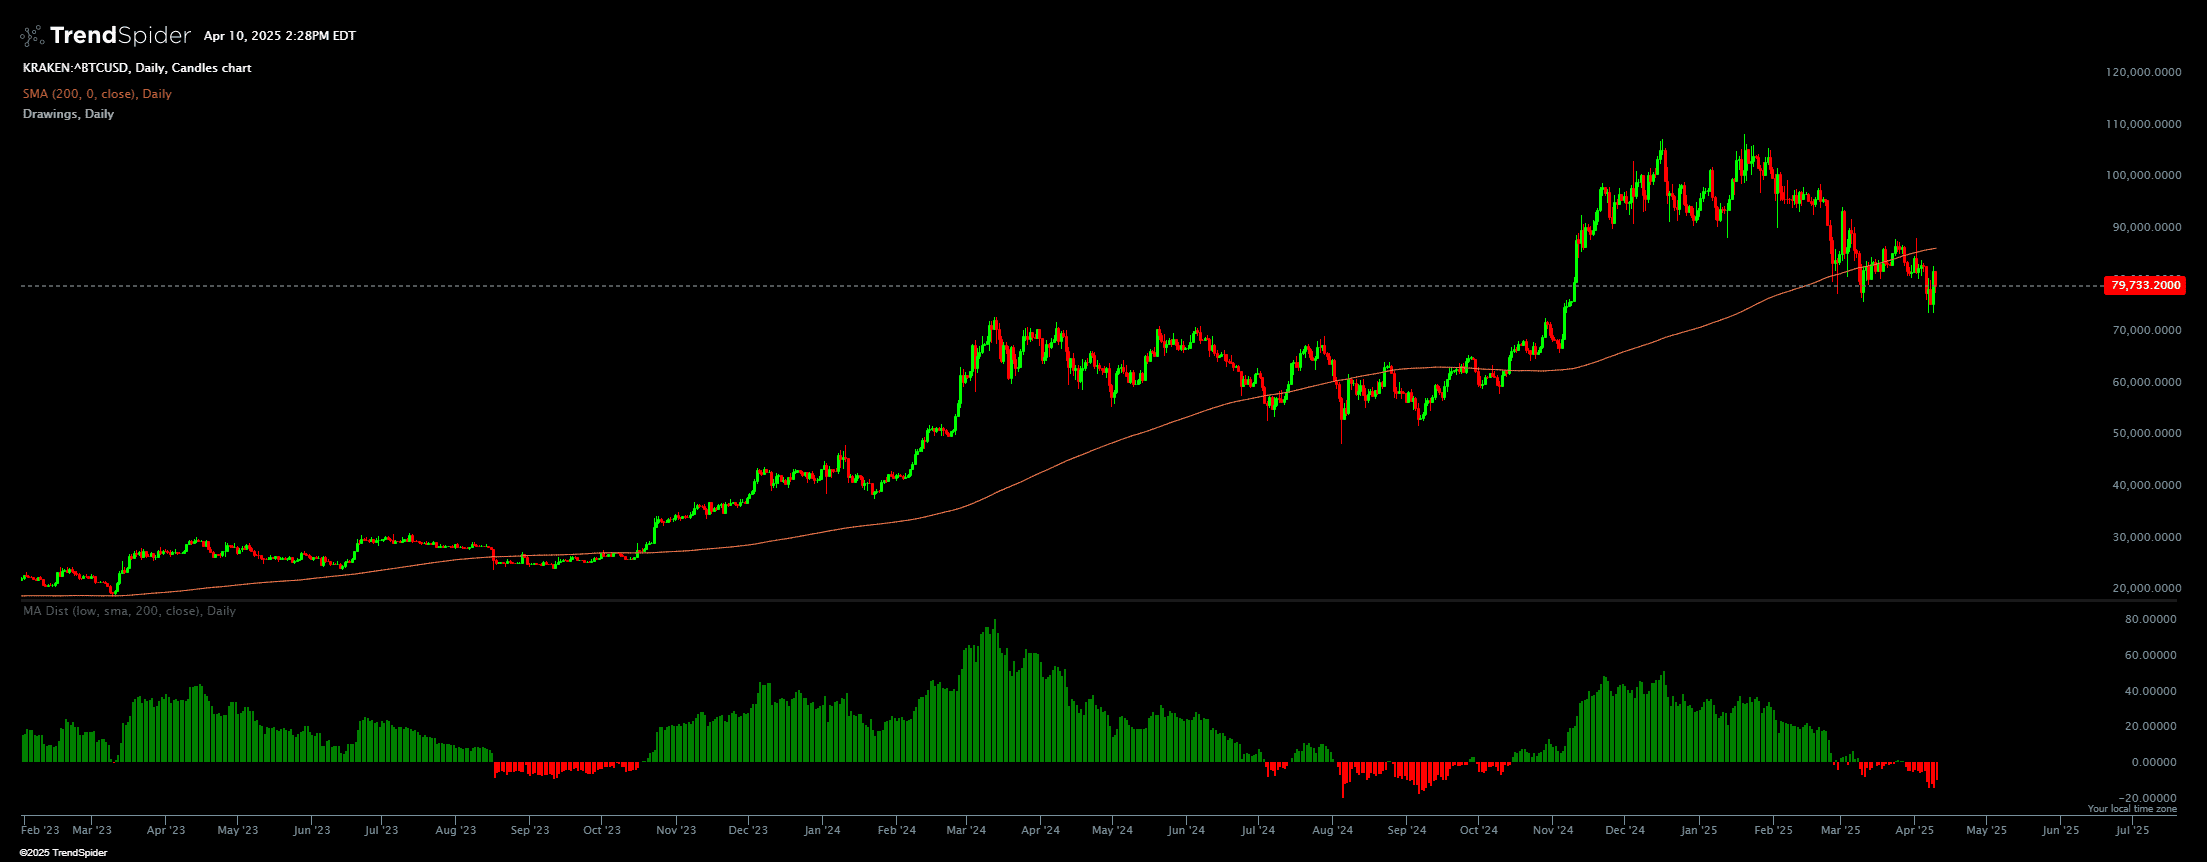
This indicators measure the distance% the 200 SMA indicator is from close price.
Source code
This indicator had been implemented by TrendSpider Team in JavaScript on TrendSpider. Check out the developer documentation to learn more about JS on TrendSpider.
// This indicator code was potentially generated using AI. It was not checked by Quality Assurance
// and did not pass any quality assurance processes used at TrendSpider
// As a result, I can’t guarantee that it will operate as expected in all cases and you should
// use caution when using this indicator. Consider it for informational purposes only.

describe_indicator('MA Distance% from Close', 'lower', { decimals: 'by_symbol_+1', shortName: 'MA Dist' });

// Input parameters for the indicator
const priceSource = input.select('Price Source', 'low', ['open', 'high', 'low', 'close']);
const maType = input.select('MA Type', 'sma', constants.ma_types);
const maLength = input.number('MA Length', 200, { min: 2, max: 250 });
const maPriceSource = input.select('MA Price Source', 'close', ['open', 'high', 'low', 'close']);

// Get the selected price source for price and moving average
const price = market[priceSource];
const maPrice = market[maPriceSource];

// Get a reference to the MA function based on the selected MA type
const computeMA = indicators[maType];

// Calculate the moving average using the selected price source for the MA
const ma = computeMA(maPrice, maLength);

// Calculate the distance between the price and the moving average
const distance = sub(price, ma);

// Convert the distance to a percentage of the moving average
const distancePercent = div(mult(distance, 100), ma);

// Determine the bar colors based on the distance percentage
const barColors = distancePercent.map(value => value > 0 ? 'green' : 'red');

// Paint the distance percentage as a histogram with the determined bar colors
paint(distancePercent, { name: 'MA Distance%', color: barColors, style: 'histogram' });
Automated technical analysis software. For traders, by traders.