EMA Crossover Signals
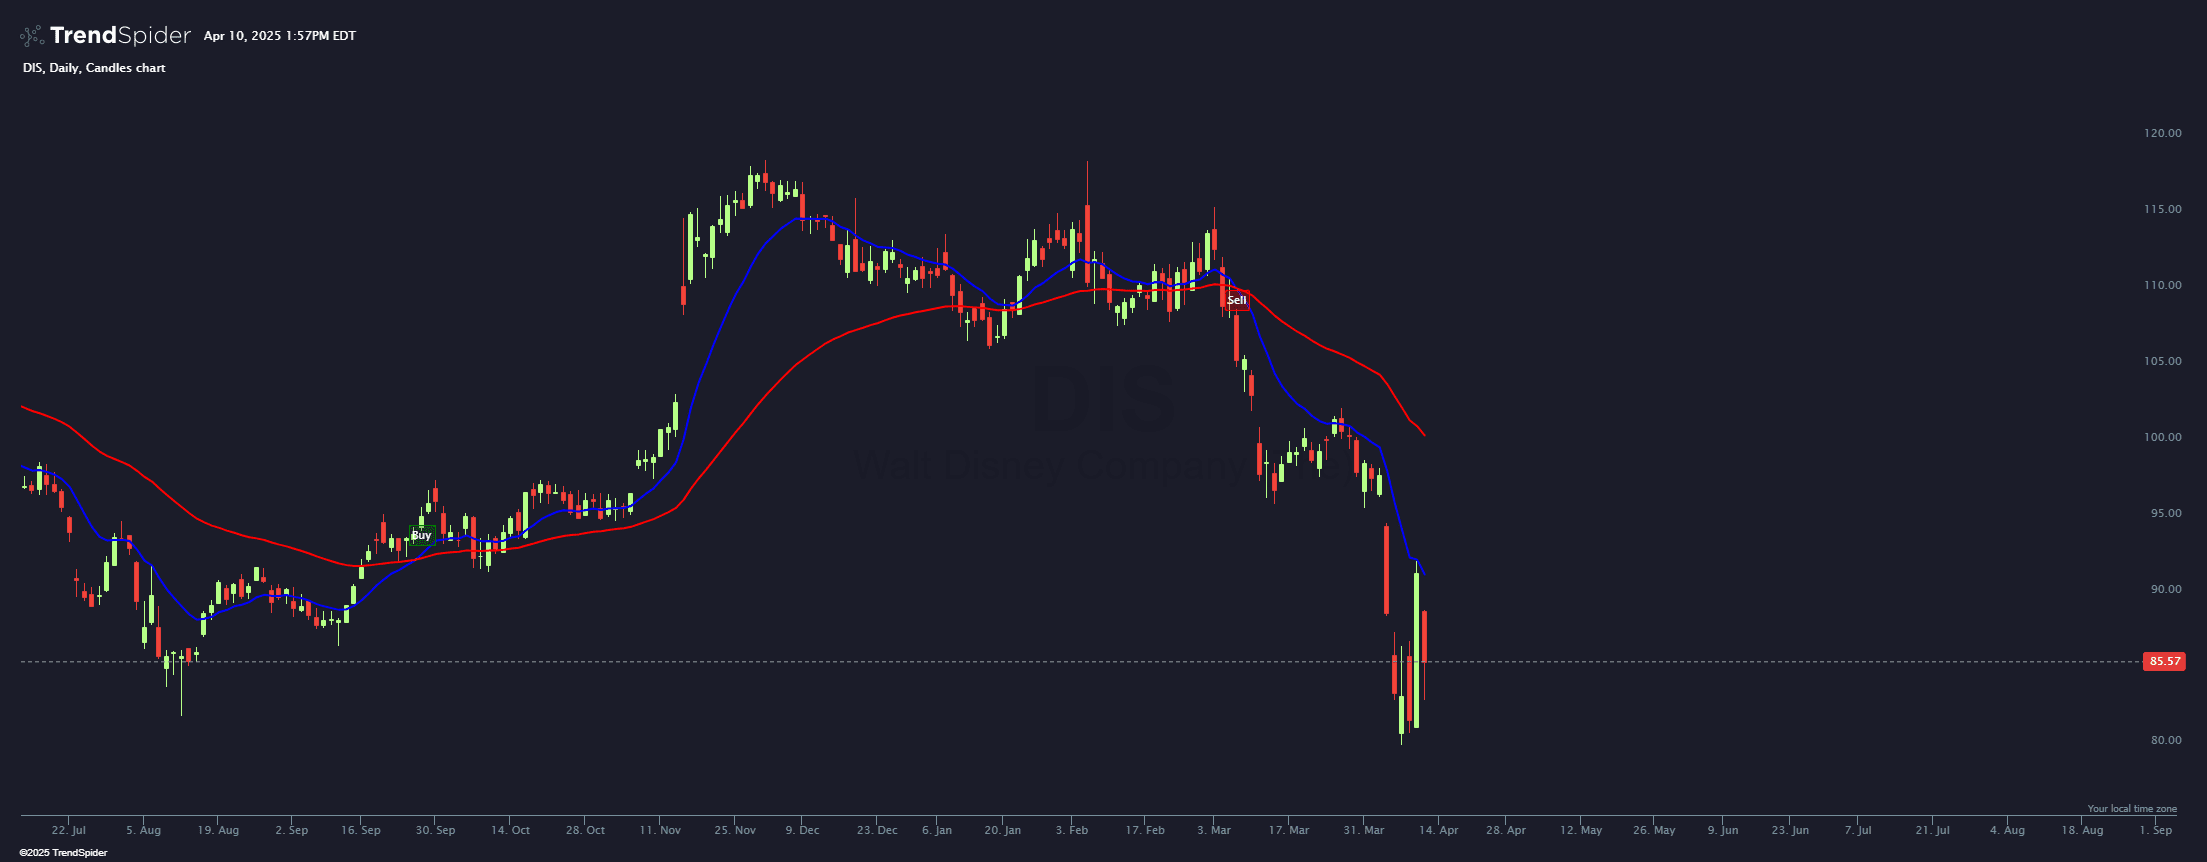
This indicator shows an example of how to paint a buy signal on your chart when EMA cross occurs. These labels can be referenced in visual scripting to create alerts, scans, strategies, etc.
Source code
This indicator had been implemented by TrendSpider Team in JavaScript on TrendSpider. Check out the developer documentation to learn more about JS on TrendSpider.
// This indicator was made by AI and has not been QA checked by the TrendSpider development team. The indicator is for entertainment purposes only.

describe_indicator('EMA Crossover Signals', 'price', { shortName: 'EMACross' });

// Function to calculate the EMA crossover, plot the indicators, and plot buy/sell signals
function EMA_Crossover_Signals(emaShortLength, emaLongLength, arrowOffset) {
    // Calculate the EMAs
    const emaShort = ema(close, emaShortLength);
    const emaLong = ema(close, emaLongLength);

    // Series to track the buy and sell signals
    const buySignalSeries = series_of(null);
    const sellSignalSeries = series_of(null);

    // Series to track the boolean conditions for registering signals
    const buyConditionSeries = series_of(false);
    const sellConditionSeries = series_of(false);

    // Check for buy signals: When EMA Short crosses above EMA Long
    // Check for sell signals: When EMA Short crosses below EMA Long
    for (let i = 1; i < close.length; i++) {
        // Buy signal
        if (emaShort[i - 1] <= emaLong[i - 1] && emaShort[i] > emaLong[i]) {
            buySignalSeries[i] = 'Buy';
            buyConditionSeries[i] = true;
        }
        // Sell signal
        if (emaShort[i - 1] >= emaLong[i - 1] && emaShort[i] < emaLong[i]) {
            sellSignalSeries[i] = 'Sell';
            sellConditionSeries[i] = true;
        }
    }

    // Paint the short EMA
    paint(emaShort, {
        name: `EMA ${emaShortLength}`,
        color: 'blue',
        thickness: 2,
        style: 'line'
    });

    // Paint the long EMA
    paint(emaLong, {
        name: `EMA ${emaLongLength}`,
        color: 'red',
        thickness: 2,
        style: 'line'
    });

    // Plot buy signals as green labels below the candles
    paint(buySignalSeries, {
        style: 'labels_below',
        color: 'white',
        backgroundColor: 'green',
        verticalOffset: arrowOffset,
        text: 'Buy'
    });

    // Plot sell signals as red labels above the candles
    paint(sellSignalSeries, {
        style: 'labels_above',
        color: 'white',
        backgroundColor: 'red',
        verticalOffset: arrowOffset,
        text: 'Sell'
    });

    // Register signals for visual scripting
    register_signal(buyConditionSeries, 'EMA Crossover Buy Signal');
    register_signal(sellConditionSeries, 'EMA Crossover Sell Signal');
}

// Set default parameters for the function
const emaShortLength = 13;
const emaLongLength = 50;
const arrowOffset = -10;

// Call the EMA crossover function
EMA_Crossover_Signals(emaShortLength, emaLongLength, arrowOffset);
Automated technical analysis software. For traders, by traders.