Fractal Channel
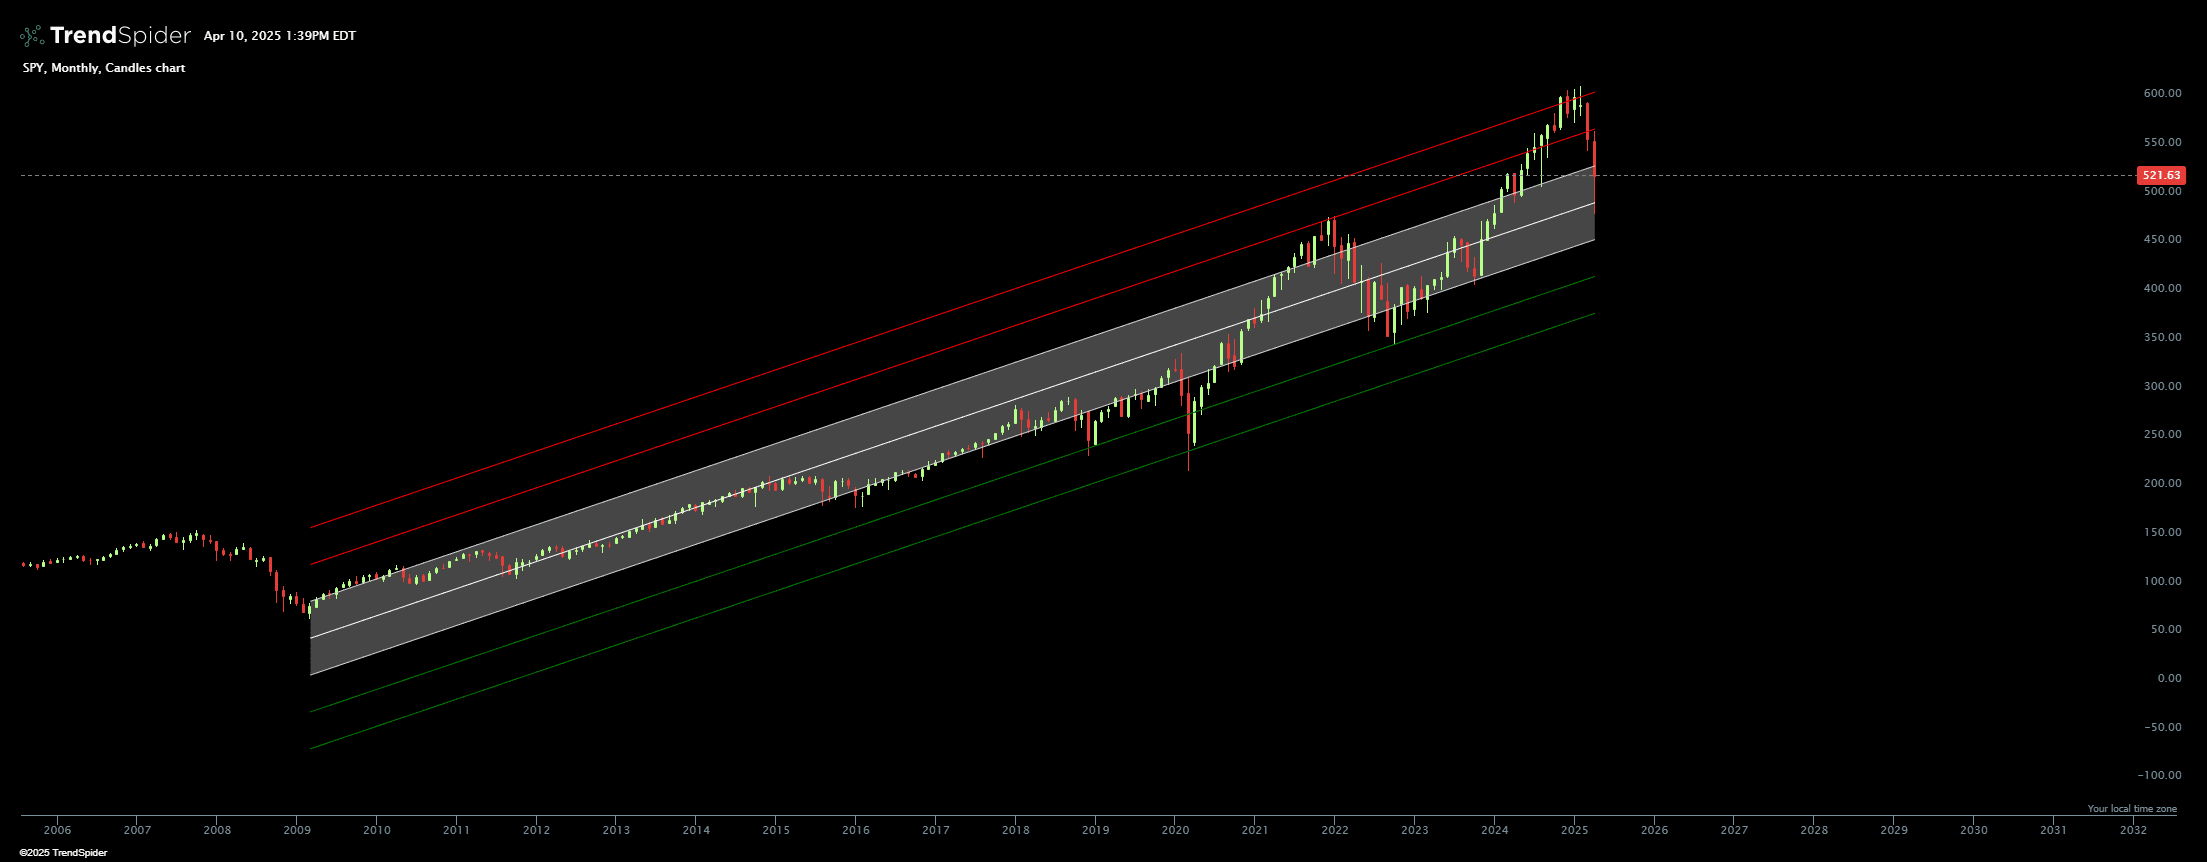
This indicator paints a channel on your chart using fractal highs and lows.
Source code
This indicator had been implemented by TrendSpider Team in JavaScript on TrendSpider. Check out the developer documentation to learn more about JS on TrendSpider.
// This indicator code was generated using AI. It was not checked by Quality Assurance
// and did not pass any quality assurance processes that we normally would use at TrendSpider
// As a result, we can’t guarantee that it will operate as expected in all cases and you should
// use caution when using this indicator. Consider it for informational purposes only.
describe_indicator('Fractal Channel');

// --- 1) Parameters ---
const fractalPeriod = input.number('Fractal Period', 5, { min: 2, max: 10 });

// Bars to look back for anchors
const anchorLookbackStart = 200; // how far back to start looking
const anchorLookbackEnd   = 50;  // how far back to stop looking

// --- 2) Compute Fractals ---
const fractals = {
    high: fractal_high(high, fractalPeriod),
    low:  fractal_low(low, fractalPeriod)
};

// --- 3) Define the lookback window ---
// e.g. from (current_length - 200) up to (current_length - 50)
const startIndex = Math.max(0, close.length - anchorLookbackStart);
const endIndex   = close.length - anchorLookbackEnd;
assert(endIndex > startIndex, 'Not enough bars to form anchor window.');

// --- 4) Find highest fractal high and lowest fractal low *only* within that window ---
let highestFractalIndex = null;
let highestFractalValue = -Infinity;
let lowestFractalIndex  = null;
let lowestFractalValue  = Infinity;

for (let i = startIndex; i < endIndex; i++) {
    if (fractals.high[i] !== null && fractals.high[i] > highestFractalValue) {
        highestFractalValue = fractals.high[i];
        highestFractalIndex = i;
    }
    if (fractals.low[i] !== null && fractals.low[i] < lowestFractalValue) {
        lowestFractalValue = fractals.low[i];
        lowestFractalIndex = i;
    }
}

assert(
    highestFractalIndex !== null && lowestFractalIndex !== null,
    'No valid fractal high/low found in the 200–50 bars‐ago window.'
);

// --- 5) Compute a linear regression from the earliest of those anchors to the present ---
const regressionStart = Math.min(highestFractalIndex, lowestFractalIndex);

// Build arrays (x,y) for the chosen data subset
const x = [];
const y = [];
for (let i = regressionStart; i < close.length; i++) {
    x.push(i - regressionStart);
    y.push(close[i]);
}

const n = x.length;
const sumX  = x.reduce((a, b) => a + b, 0);
const sumY  = y.reduce((a, b) => a + b, 0);
const sumXY = x.reduce((acc, xi, idx) => acc + xi * y[idx], 0);
const sumX2 = x.reduce((acc, xi) => acc + xi * xi, 0);

// Simple linear regression slope & intercept
const slope = (n * sumXY - sumX * sumY) / (n * sumX2 - sumX * sumX);
const intercept = (sumY - slope * sumX) / n;

// --- 6) Create & paint the baseline regression line ---
const trendline = series_of(null);
for (let i = regressionStart; i < close.length; i++) {
    const xVal = i - regressionStart;
    trendline[i] = slope * xVal + intercept;
}

paint(trendline, {
    name: 'Regression Trendline',
    color: 'rgba(255, 255, 255, 0.6)',
    style: 'line',
    width: 2
});

// --- 7) Compute standard deviation bands ---
const priceSeg   = close.slice(regressionStart);
const trendSeg   = trendline.slice(regressionStart);
const deviations = for_every(priceSeg, trendSeg, (c, t) => Math.abs(c - t));
const stdDev = Math.sqrt(deviations.reduce((a, b) => a + b * b, 0) / deviations.length);

// 1x std dev upper/lower
const upperBand = trendline.map(t => t !== null ? t + stdDev : null);
const lowerBand = trendline.map(t => t !== null ? t - stdDev : null);

paint(upperBand, {
    name: 'Upper Band (1 SD)',
    color: 'rgba(211, 211, 211, 0.4)',
    style: 'line',
    width: 1
});

paint(lowerBand, {
    name: 'Lower Band (1 SD)',
    color: 'rgba(211, 211, 211, 0.4)',
    style: 'line',
    width: 1
});

fill(
    paint(upperBand, { hidden: true }),
    paint(lowerBand, { hidden: true }),
    'rgba(211, 211, 211, 0.1)'
);

// --- 8) Paint anchor labels for the highest/lowest fractal points ---
paint_label_at_line(
    paint(series_of(highestFractalValue), { hidden: true }),
    highestFractalIndex,
    'Highest Anchor',
    { color: 'white', border_color: 'red', border_width: 1 }
);

paint_label_at_line(
    paint(series_of(lowestFractalValue), { hidden: true }),
    lowestFractalIndex,
    'Lowest Anchor',
    { color: 'white', border_color: 'green', border_width: 1 }
);

// --- 9) Add additional trendlines above and below the channel ---

// Upper extensions (red)
const upperBand2SD = trendline.map(t => t !== null ? t + 2 * stdDev : null);
const upperBand3SD = trendline.map(t => t !== null ? t + 3 * stdDev : null);

paint(upperBand2SD, {
    name: 'Upper Band (2 SD)',
    color: 'red',
    style: 'line',
    width: 1
});

paint(upperBand3SD, {
    name: 'Upper Band (3 SD)',
    color: 'red',
    style: 'line',
    width: 1
});

// Lower extensions (green)
const lowerBand2SD = trendline.map(t => t !== null ? t - 2 * stdDev : null);
const lowerBand3SD = trendline.map(t => t !== null ? t - 3 * stdDev : null);

paint(lowerBand2SD, {
    name: 'Lower Band (2 SD)',
    color: 'green',
    style: 'line',
    width: 1
});

paint(lowerBand3SD, {
    name: 'Lower Band (3 SD)',
    color: 'green',
    style: 'line',
    width: 1
});
Automated technical analysis software. For traders, by traders.