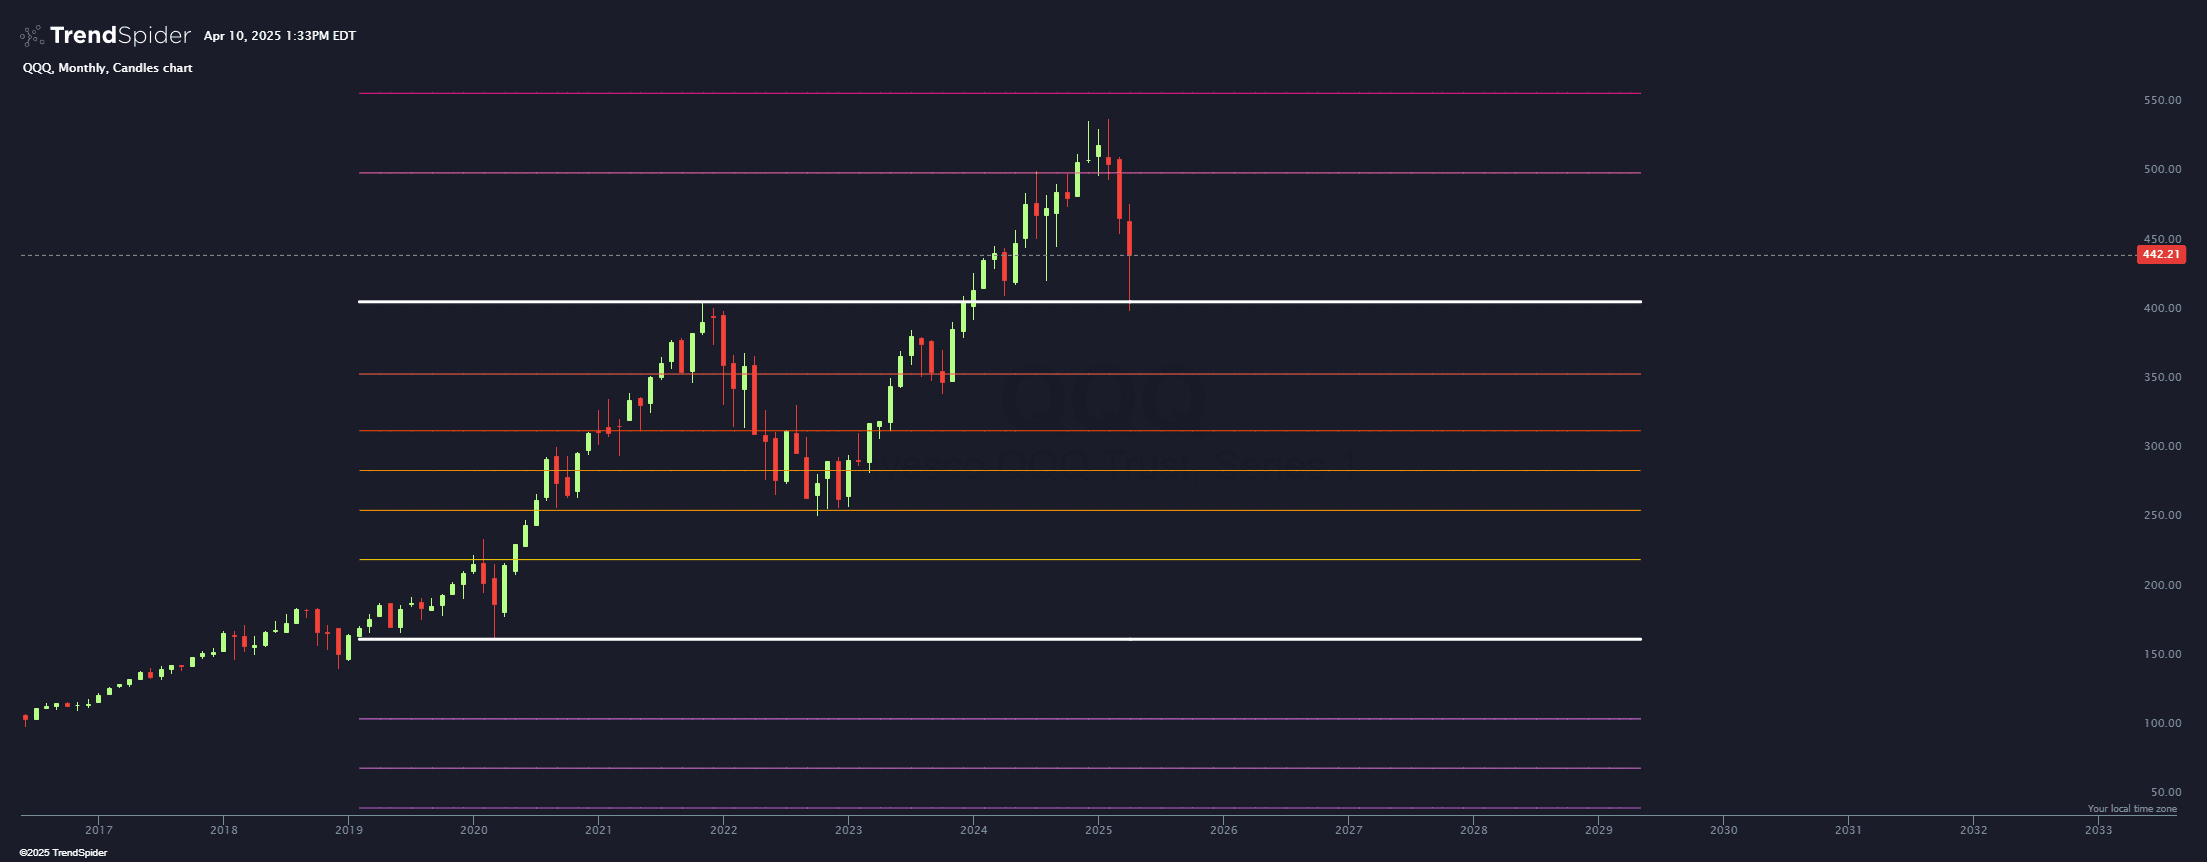
Auto Fib

This indicator automatically paints fibonacci retracement levels based on swing high and lows. Adjust the lookback period, offset, and number of projection bars to fit your needs.
Source code
This indicator had been implemented by TrendSpider Team in JavaScript on TrendSpider. Check out the developer documentation to learn more about JS on TrendSpider.
// This indicator code was generated using AI. It was not checked by Quality Assurance
// and did not pass any quality assurance processes that we normally would use at TrendSpider
// As a result, we can’t guarantee that it will operate as expected in all cases and you should
// use caution when using this indicator. Consider it for informational purposes only.
describe_indicator('Auto Fib', 'price', { shortName: 'Fib+' });

// Input for lookback and offset periods
const lookbackPeriod = 50; // Lookback over 50 periods for medium-term range
const offsetPeriod = 25;   // Offset 25 periods back for predictive relevance
const projectionBars = 50;  // Project 50 bars into the future (TrendSpider max)

// Fibonacci levels with updated colors and thickness
const fibLevels = [
    { level: -1.0, color: '#4A00E0', name: '-100%', thickness: 1 },     // Deep blue
    { level: -0.786, color: '#7B68EE', name: '-78.6%', thickness: 1 },  // Medium slate blue
    { level: -0.618, color: '#9370DB', name: '-61.8%', thickness: 1 },  // Medium purple
    { level: -0.5, color: '#BA55D3', name: '-50%', thickness: 1 },      // Medium orchid
    { level: -0.382, color: '#DA70D6', name: '-38.2%', thickness: 1 },  // Orchid
    { level: -0.236, color: '#EE82EE', name: '-23.6%', thickness: 1 },  // Violet
    { level: 0.0, color: 'white', name: '0%', thickness: 3 },         // Black (thicker)
    { level: 0.236, color: '#FFD700', name: '23.6%', thickness: 1 },    // Gold
    { level: 0.382, color: '#FFA500', name: '38.2%', thickness: 1 },    // Orange
    { level: 0.5, color: '#FF8C00', name: '50%', thickness: 1 },        // Dark orange
    { level: 0.618, color: '#FF4500', name: '61.8%', thickness: 1 },    // Orange red
    { level: 0.786, color: '#FF6347', name: '78.6%', thickness: 1 },    // Tomato
    { level: 1.0, color: 'white', name: '100%', thickness: 3 },       // Gray (thicker)
    { level: 1.382, color: '#FF69B4', name: '138.2%', thickness: 1 },   // Hot pink
    { level: 1.618, color: '#FF1493', name: '161.8%', thickness: 1 },   // Deep pink
    { level: 2.0, color: '#DC143C', name: '200%', thickness: 1 },       // Crimson
    { level: 2.618, color: '#B22222', name: '261.8%', thickness: 1 },   // Firebrick
    { level: 4.236, color: '#8B0000', name: '423.6%', thickness: 1 }    // Dark red
];

// Define the range to analyze
const startIndex = time.length - offsetPeriod - lookbackPeriod; // Starting 75 periods back
const endIndex = time.length - offsetPeriod;                   // Up to 25 periods back

// Ensure the range is valid
assert(startIndex >= 0, "Not enough data to calculate Fibonacci levels.");

// Find the highest high and lowest low over the range
const highRange = high.slice(startIndex, endIndex);
const lowRange = low.slice(startIndex, endIndex);
const highestHigh = Math.max(...highRange);
const lowestLow = Math.min(...lowRange);

// Calculate the range
const range = highestHigh - lowestLow;

// Paint Fibonacci levels and project them into the future
fibLevels.forEach(({ level, color, name, thickness }) => {
    const fibValue = lowestLow + range * level;
    // Land the levels on the chart up to the current time
    const series = land_points_onto_series(
        [time[startIndex], time[time.length - 1]],
        [fibValue, fibValue],
        time
    );
    const fibSeries = interpolate_sparse_series(series, 'constant');
    // Paint the levels
    const lineRef = paint(fibSeries, {
        name: `${name}`,
        color: color,
        thickness: thickness,
        style: 'ladder',
        ignoreWhenScaling: true
    });
    // Project the levels into the future
    const projectionValues = Array(projectionBars).fill(fibValue);
    paint_projection(lineRef, projectionValues);
});
