ATR Distribution
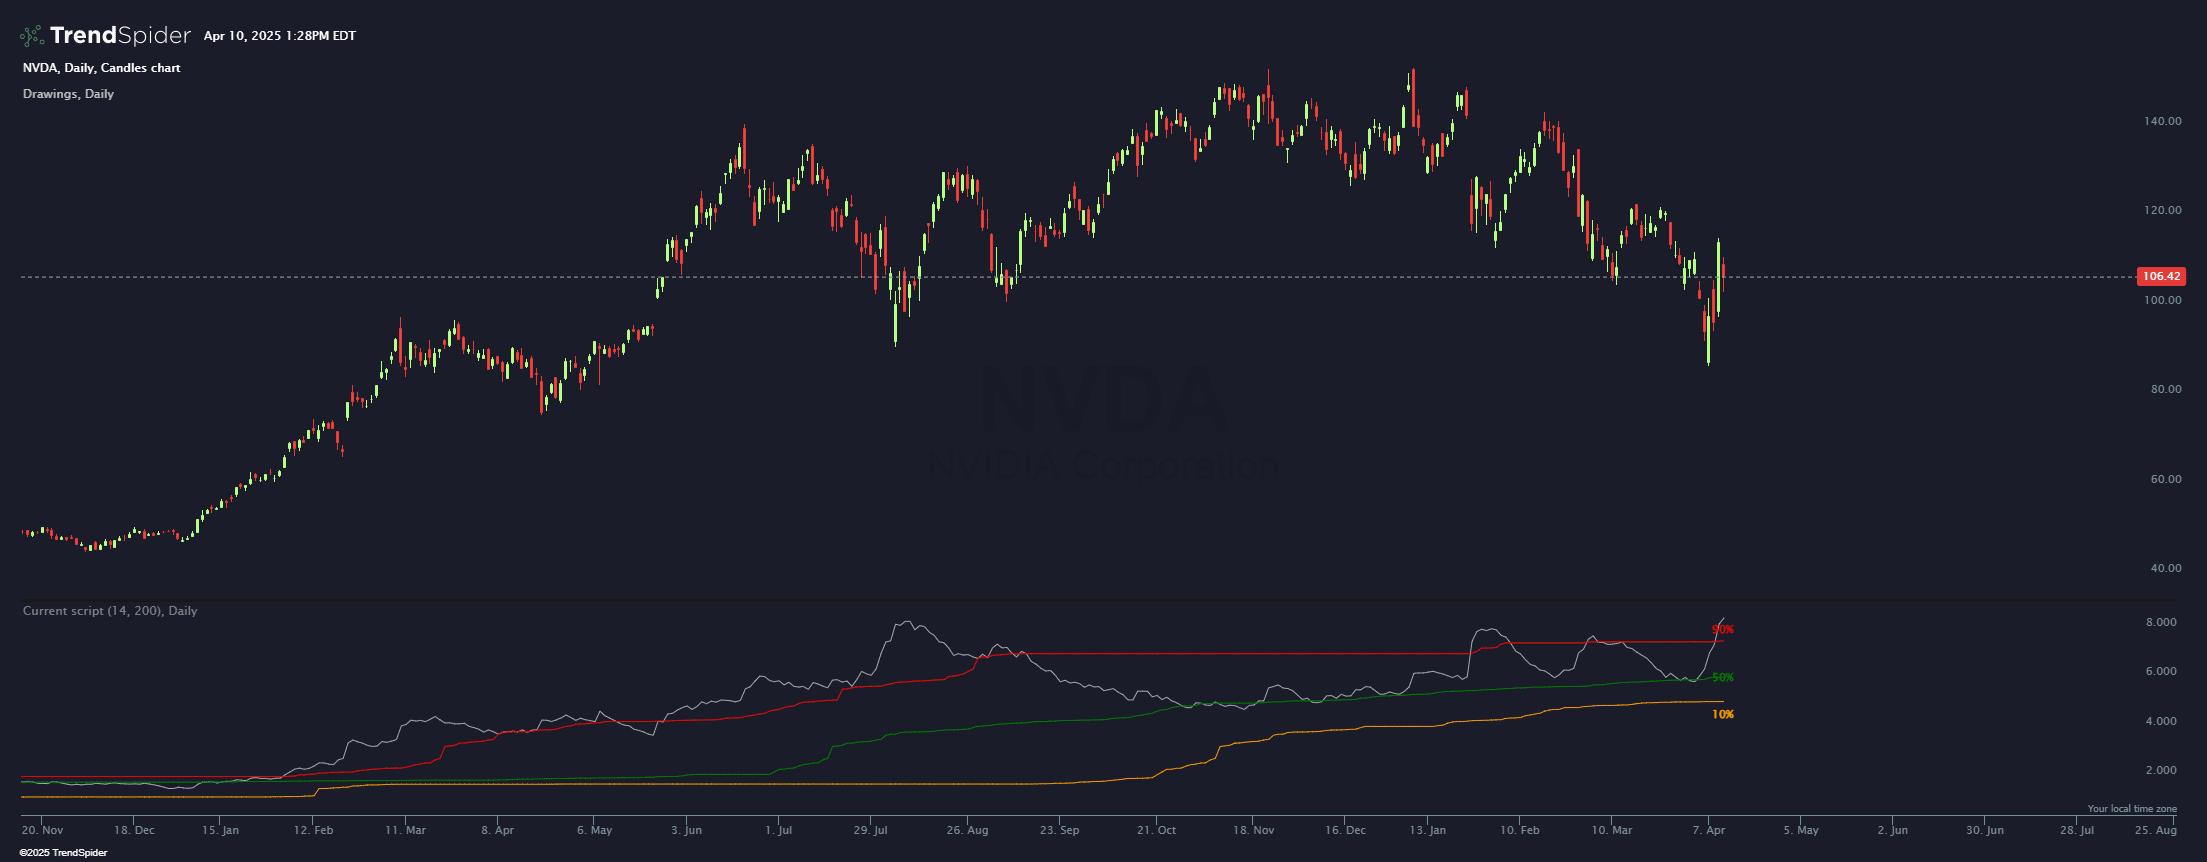
This indicator paints ATR + the distribution levels of where ATR has been historically.
Source code
This indicator had been implemented by TrendSpider Team in JavaScript on TrendSpider. Check out the developer documentation to learn more about JS on TrendSpider.
// This indicator code was generated using AI. It was not checked by Quality Assurance
// and did not pass any quality assurance processes that we normally would use at TrendSpider
// As a result, we can’t guarantee that it will operate as expected in all cases and you should
// use caution when using this indicator. Consider it for informational purposes only.
describe_indicator('ATR Distribution', 'lower', { warmup: 5000 });

// Input for ATR period
const atrPeriod = input.number('ATR Period', 14, { min: 1 });

// Input for lookback period
const lookbackPeriod = input.number('Lookback Period', 200, { min: 1 });

// Calculate ATR
const myAtr = atr(atrPeriod);

// Function to calculate percentile
const percentile = (arr, p) => {
    const sorted = arr.slice().sort((a, b) => a - b);
    const index = Math.floor(p / 100 * (sorted.length - 1));
    return sorted[index];
};

// Function to get the last n elements of an array
const lastN = (arr, n) => arr.slice(-n);

// Calculate percentiles
const atr90 = for_every(myAtr, (_atr, _prevValue, i) => {
    if (i < lookbackPeriod - 1) return null;
    return percentile(lastN(myAtr.slice(0, i + 1), lookbackPeriod), 90);
});

const atr50 = for_every(myAtr, (_atr, _prevValue, i) => {
    if (i < lookbackPeriod - 1) return null;
    return percentile(lastN(myAtr.slice(0, i + 1), lookbackPeriod), 50);
});

// Calculate 10th percentile
const atr10 = for_every(myAtr, (_atr, _prevValue, i) => {
    if (i < lookbackPeriod - 1) return null;
    return percentile(lastN(myAtr.slice(0, i + 1), lookbackPeriod), 10);
});

// Paint ATR
paint(myAtr, { color: ' darkgrey', name: 'ATR' });

// Paint percentile lines and store the references
const atr90Line = paint(atr90, { color: 'red', name: '90th Percentile', style: 'line' });
const atr50Line = paint(atr50, { color: 'green', name: '50th Percentile', style: 'line' });
const atr10Line = paint(atr10, { color: 'orange', name: '10th Percentile', style: 'line' });

// Add text labels to the right side of the chart
const lastIndex = myAtr.length - 1;
paint_label_at_line(atr90Line, lastIndex, '90%', { color: 'red', vertical_align: 'top' });
paint_label_at_line(atr50Line, lastIndex, '50%', { color: 'green', vertical_align: 'middle' });
paint_label_at_line(atr10Line, lastIndex, '10%', { color: 'orange', vertical_align: 'bottom' });

// Register signals for potential use in alerts or strategies
const atrAbove90 = for_every(myAtr, atr90, (a, b) => a > b);
const atrBelow50 = for_every(myAtr, atr50, (a, b) => a < b);
const atrBelow10 = for_every(myAtr, atr10, (a, b) => a < b);
register_signal(atrAbove90, 'ATR above 90th percentile');
register_signal(atrBelow50, 'ATR below 50th percentile');
register_signal(atrBelow10, 'ATR below 10th percentile');
Automated technical analysis software. For traders, by traders.