Average Daily Range (ADR) with Timeframe Lock
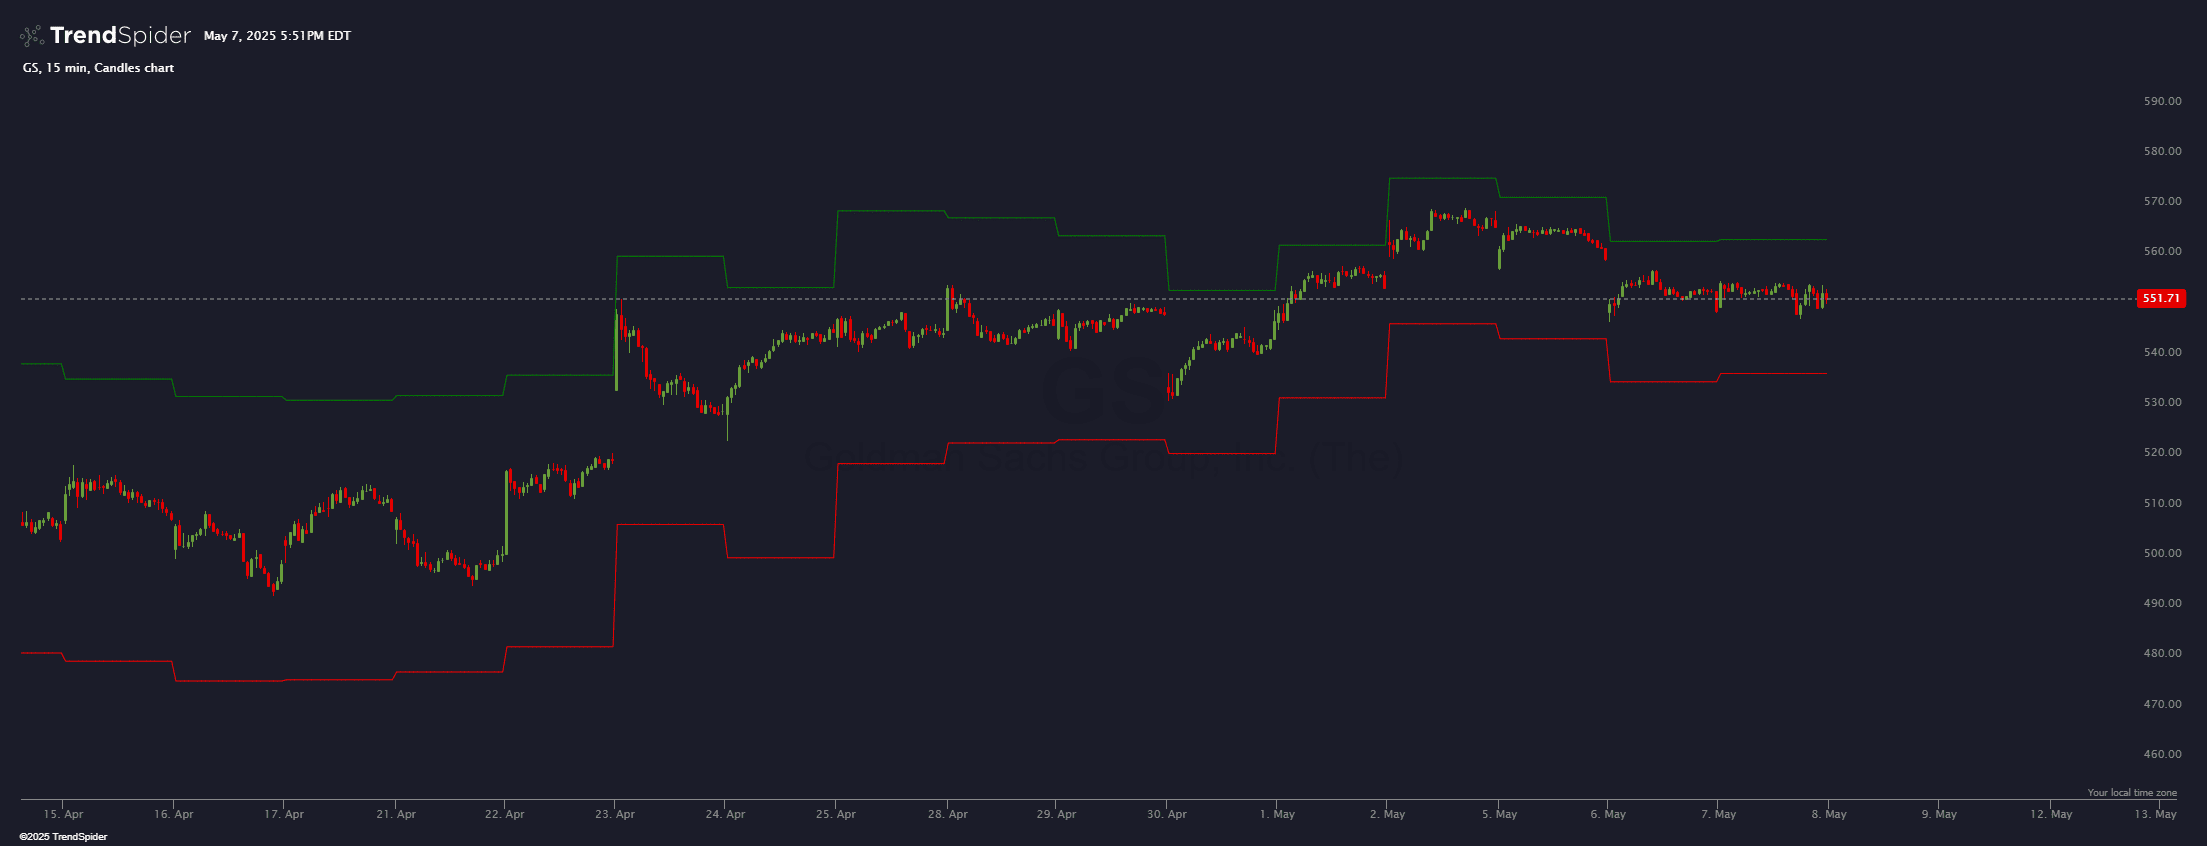
This script calculates the Average Daily Range (ADR) based on a user-defined lookback period, then plots two horizontal lines: the ADR High (current open + ADR) and the ADR Low (current open - ADR). These lines update at the start of each new trading session and help traders visualize potential price levels based on historical volatility. The script also allows users to customize the ADR period and the colors of the high and low lines.
Source code
This indicator had been implemented by TrendSpider Team in JavaScript on TrendSpider. Check out the developer documentation to learn more about JS on TrendSpider.
describe_indicator('Average Daily Range (ADR) with Timeframe Lock');

// User inputs
const adrPeriod = input.number('ADR Period', 14, { min: 1 });
const adrHighColor = input.color('ADR High Color', 'green');
const adrLowColor = input.color('ADR Low Color', 'red');
const lineStyle = input.select('Line Style', 'line', ['line', 'dotted', 'ladder']);
const showLabels = input.boolean('Show ADR Labels', true);
const lockedTimeframe = input.select('Locked Timeframe', 'D', constants.time_frames);

// Helper function to calculate ADR
const calculateADR = (high, low, length) => {
    const ranges = sub(high, low);
    return sma(ranges, length);
};

// Fetch data for the locked timeframe
const lockedData = await request.history(current.ticker, lockedTimeframe);
assert(!lockedData.error, `Error fetching data: ${lockedData.error}`);

// Calculate ADR on the locked timeframe
const myADR = calculateADR(lockedData.high, lockedData.low, adrPeriod);

// Calculate ADR high and low for each candle in the locked timeframe
const adrHigh = add(lockedData.open, myADR);
const adrLow = sub(lockedData.open, myADR);

// Land ADR high and low onto the current timeframe
const myAdrHigh = land_points_onto_series(lockedData.time, adrHigh, time, 'le');
const myAdrLow = land_points_onto_series(lockedData.time, adrLow, time, 'le');

// Interpolate the landed series
const interpolatedAdrHigh = interpolate_sparse_series(myAdrHigh, 'constant');
const interpolatedAdrLow = interpolate_sparse_series(myAdrLow, 'constant');

// Paint ADR high and low lines
paint(interpolatedAdrHigh, {
    color: adrHighColor,
    name: 'ADR High',
    style: lineStyle
});

paint(interpolatedAdrLow, {
    color: adrLowColor,
    name: 'ADR Low',
    style: lineStyle
});

// Add labels if enabled
if (showLabels) {
    const lastIndex = close.length - 1;
    const lastLockedIndex = lockedData.time.length - 1;
    const lastADR = myADR[lastLockedIndex];

    paint_label_at_line(
        paint(interpolatedAdrHigh, { hidden: true }),
        lastIndex,
        `ADR High: ${lastADR.toFixed(2)}`,
        { color: adrHighColor, vertical_align: 'bottom' }
    );

    paint_label_at_line(
        paint(interpolatedAdrLow, { hidden: true }),
        lastIndex,
        `ADR Low: ${lastADR.toFixed(2)}`,
        { color: adrLowColor, vertical_align: 'top' }
    );
}
Automated technical analysis software. For traders, by traders.