HTF Open Levels

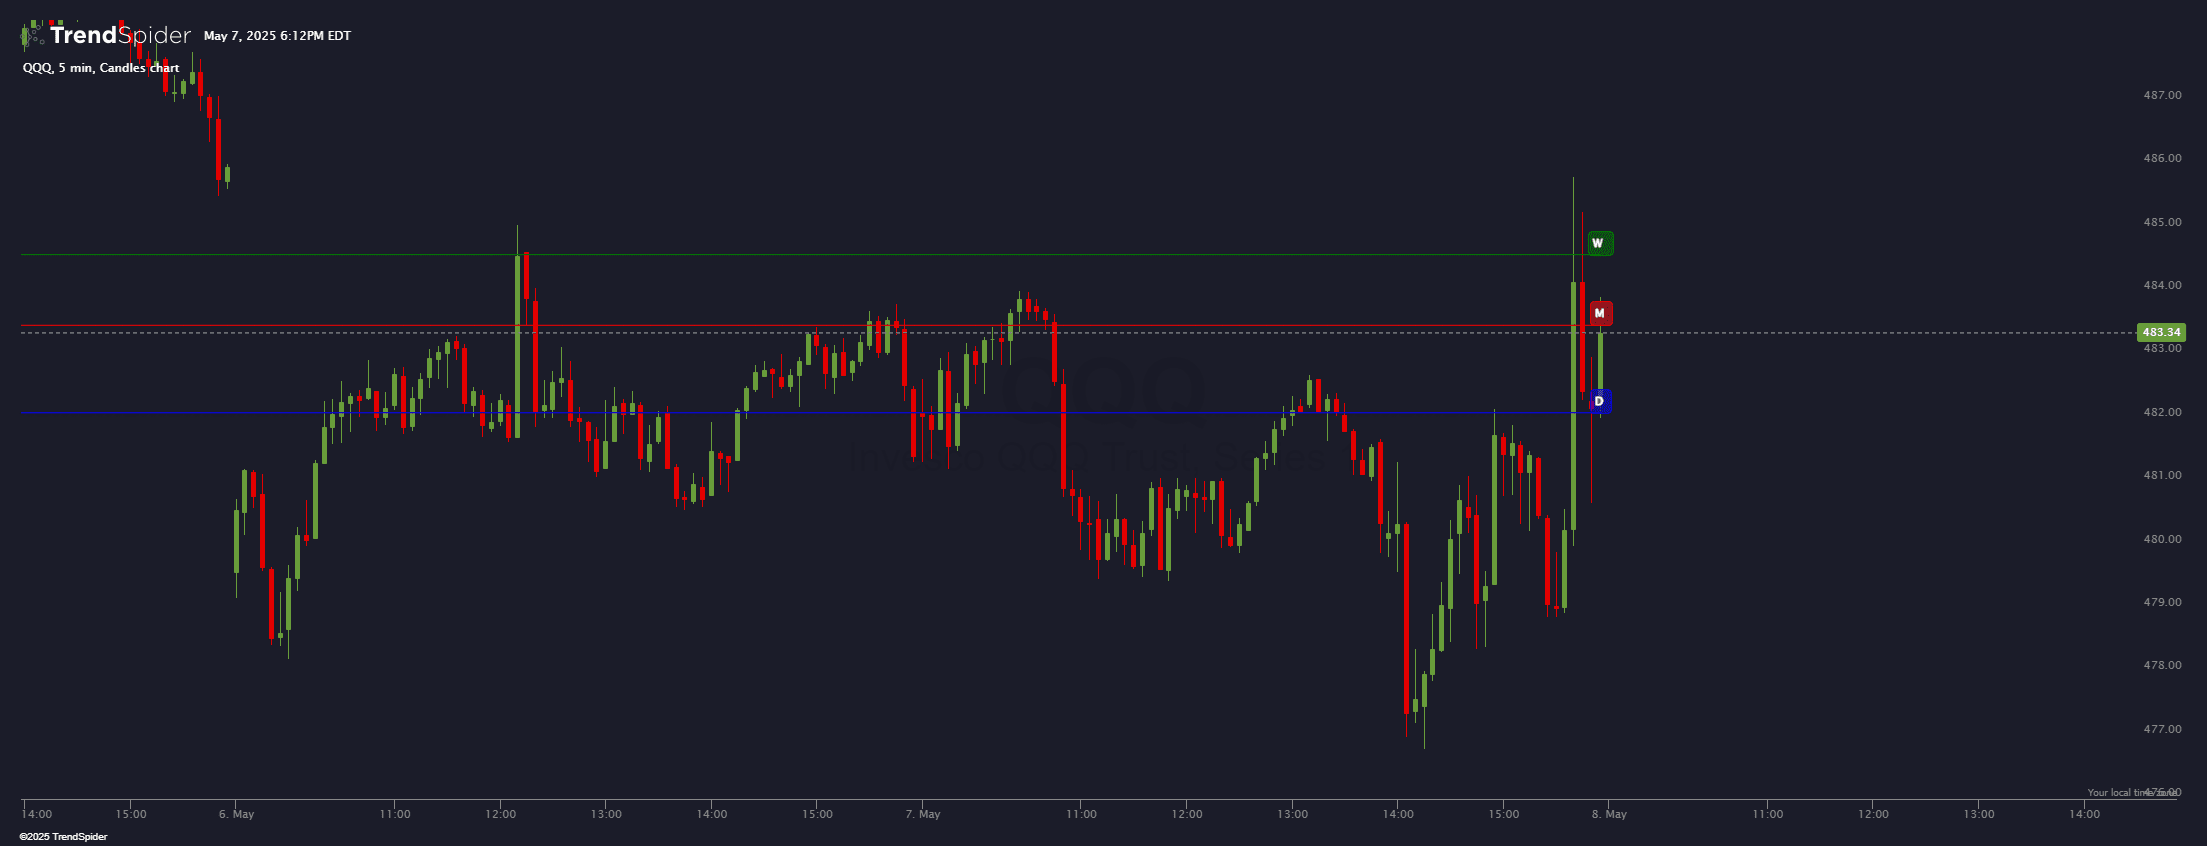
Automatically plots the Daily, Weekly, Monthly, and Yearly Open prices on your chart—helping you track key reference points with ease. Customize colors, styles, and labels to fit your strategy.
Source code
This indicator had been implemented by TrendSpider Team in JavaScript on TrendSpider. Check out the developer documentation to learn more about JS on TrendSpider.
describe_indicator('HTF Open Levels');

// Input parameters for each timeframe
const showDaily = input.boolean('Show Daily Open', true);
const showWeekly = input.boolean('Show Weekly Open', true);
const showMonthly = input.boolean('Show Monthly Open', true);
const showYearly = input.boolean('Show Yearly Open', true);

// Input parameters for line styles
const dailyColor = input.color('Daily Color', 'blue');
const weeklyColor = input.color('Weekly Color', 'green');
const monthlyColor = input.color('Monthly Color', 'red');
const yearlyColor = input.color('Yearly Color', 'purple');
const lineStyle = input.select('Line Style', 'line', ['line', 'dotted', 'ladder']);
const lineWidth = input.number('Line Width', 1, { min: 1, max: 5 });
const showLabels = input.boolean('Show Labels', true);

// New input for label opacity
const labelOpacity = input.number('Label Opacity', 0.5, { min: 0, max: 1, step: 0.1 });

// Helper function to get the open price for a specific timeframe
const getOpenPrice = async (resolution) => {
  const myData = await request.history(current.ticker, resolution);
  assert(!myData.error, `Error fetching ${resolution} data: ${myData.error}`);
  return myData.open[myData.open.length - 1];
};

// Fetch open prices for each timeframe
const dailyOpen = await getOpenPrice('D');
const weeklyOpen = await getOpenPrice('W');
const monthlyOpen = await getOpenPrice('M');
const yearlyOpen = await getOpenPrice('Y');

// Helper function to create a horizontal line
const createLine = (price, color, label) => {
  const myLine = horizontal_line(price);
  const paintedLine = paint(myLine, {
    color: color,
    width: lineWidth,
    style: lineStyle,
    name: `${label} Open`
  });

  if (showLabels) {
    const tinycolor = library('tinycolor2');
    const backgroundColor = tinycolor(color).setAlpha(labelOpacity).toRgbString();

    paint_label_at_line(paintedLine, close.length - 1, label, {
      color: 'white',
      background_color: backgroundColor,
      border_radius: 4,
      border_width: 1,
      border_color: color
    });
  }
};

// Draw lines for each timeframe if enabled
if (showDaily) createLine(dailyOpen, dailyColor, 'D');
if (showWeekly) createLine(weeklyOpen, weeklyColor, 'W');
if (showMonthly) createLine(monthlyOpen, monthlyColor, 'M');
if (showYearly) createLine(yearlyOpen, yearlyColor, 'Y');
