Customizable Candle Range

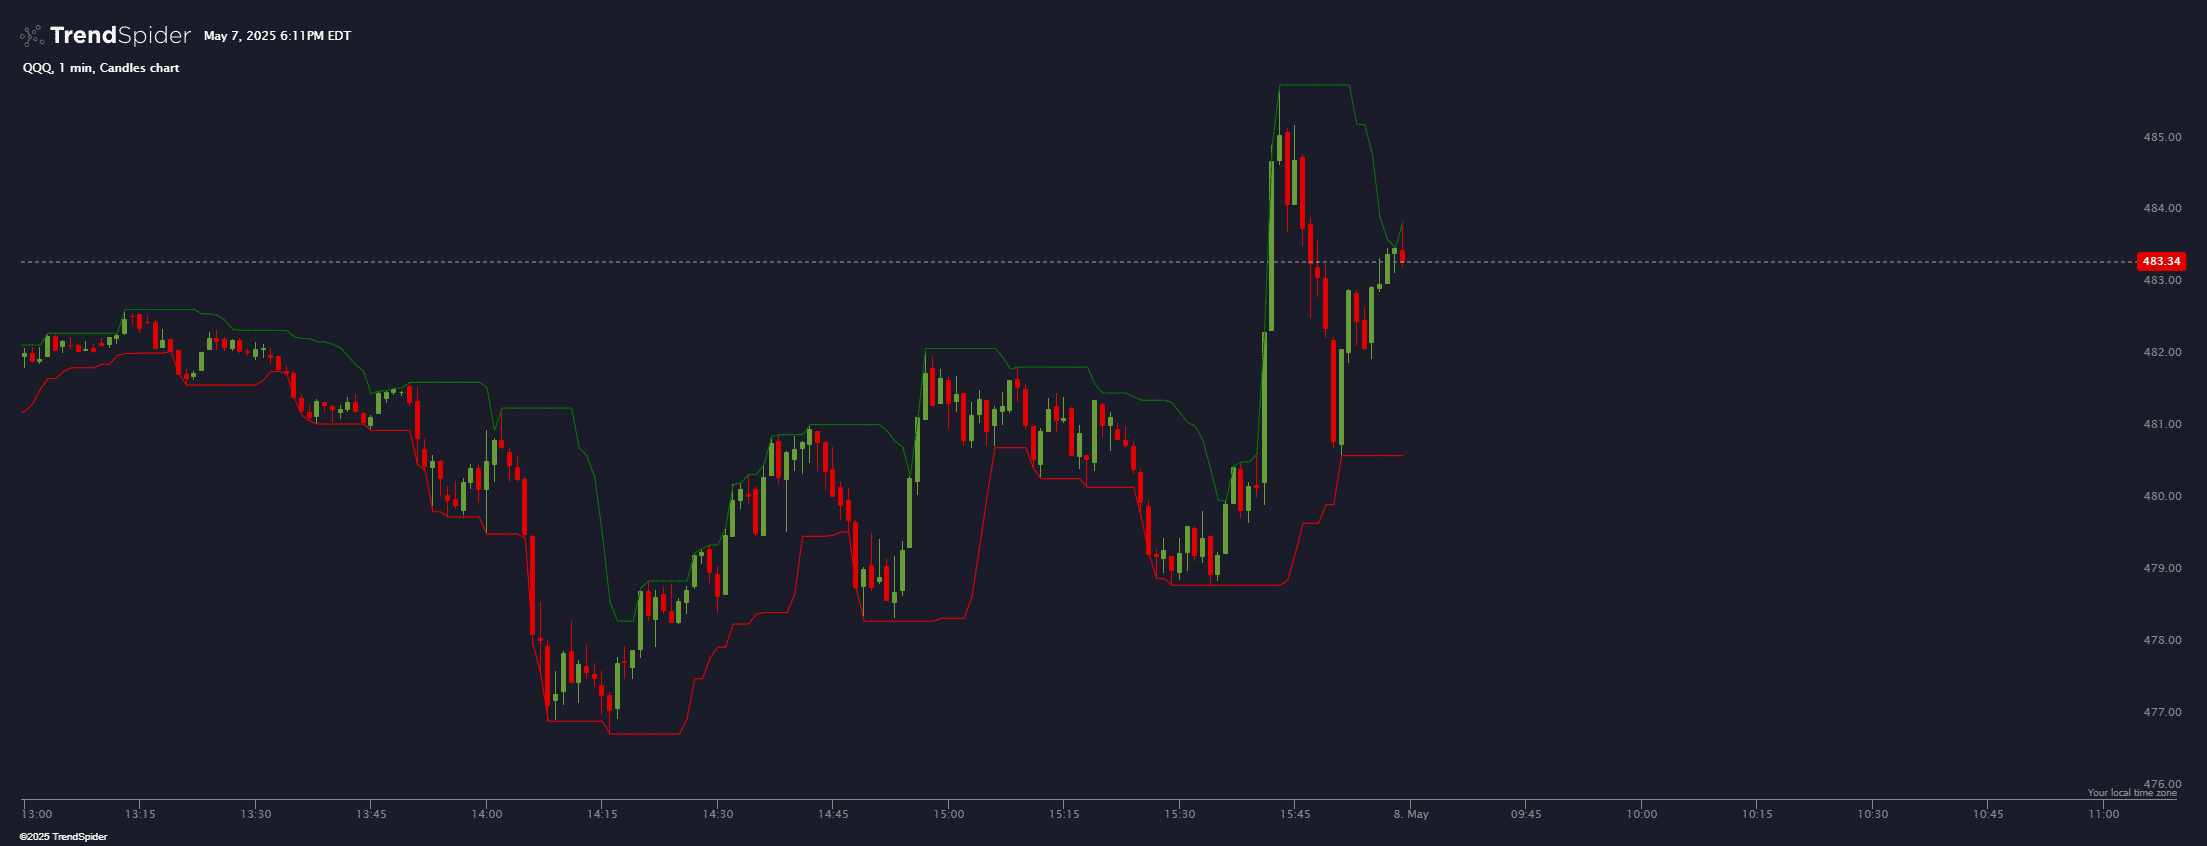
This indicator plots the highest high and lowest low over a user-defined lookback period based on a customizable price range (high-low, open-close, high-close, open-low). It displays:
Green line for the highest high (upper range).
Red line for the lowest low (lower range).
Labels are added at the most recent bar to indicate the upper and lower range levels.
Users can adjust the lookback period and select the range type for flexibility in their analysis.
Source code
This indicator had been implemented by TrendSpider Team in JavaScript on TrendSpider. Check out the developer documentation to learn more about JS on TrendSpider.
describe_indicator('Customizable Candle Range');

// Input for the lookback period
const lookback = input.number('Lookback Period', 10, { min: 1 });

// Input for the candle range
const myRange = input.select('Candle Range', 'high-low', [
    'high-low',
    'open-close',
    'high-close',
    'open-low'
]);

// Function to get the upper and lower values based on the selected range
const getRangeValues = (range) => {
    switch (range) {
        case 'high-low':
            return [high, low];
        case 'open-close':
            return [open, close];
        case 'high-close':
            return [high, close];
        case 'open-low':
            return [open, low];
        default:
            throw "Invalid range selection";
    }
};

// Get the upper and lower values based on the selected range
const [upperValues, lowerValues] = getRangeValues(myRange);

// Calculate the highest high and lowest low over the lookback period
const highestHigh = highest(upperValues, lookback);
const lowestLow = lowest(lowerValues, lookback);

// Paint the highest high line
paint(highestHigh, {
    color: 'green',
    name: 'Upper',
    style: 'line'
});

// Paint the lowest low line
paint(lowestLow, {
    color: 'red',
    name: 'Lower',
    style: 'line'
});
