Trend Strength Oscillator (TSO)
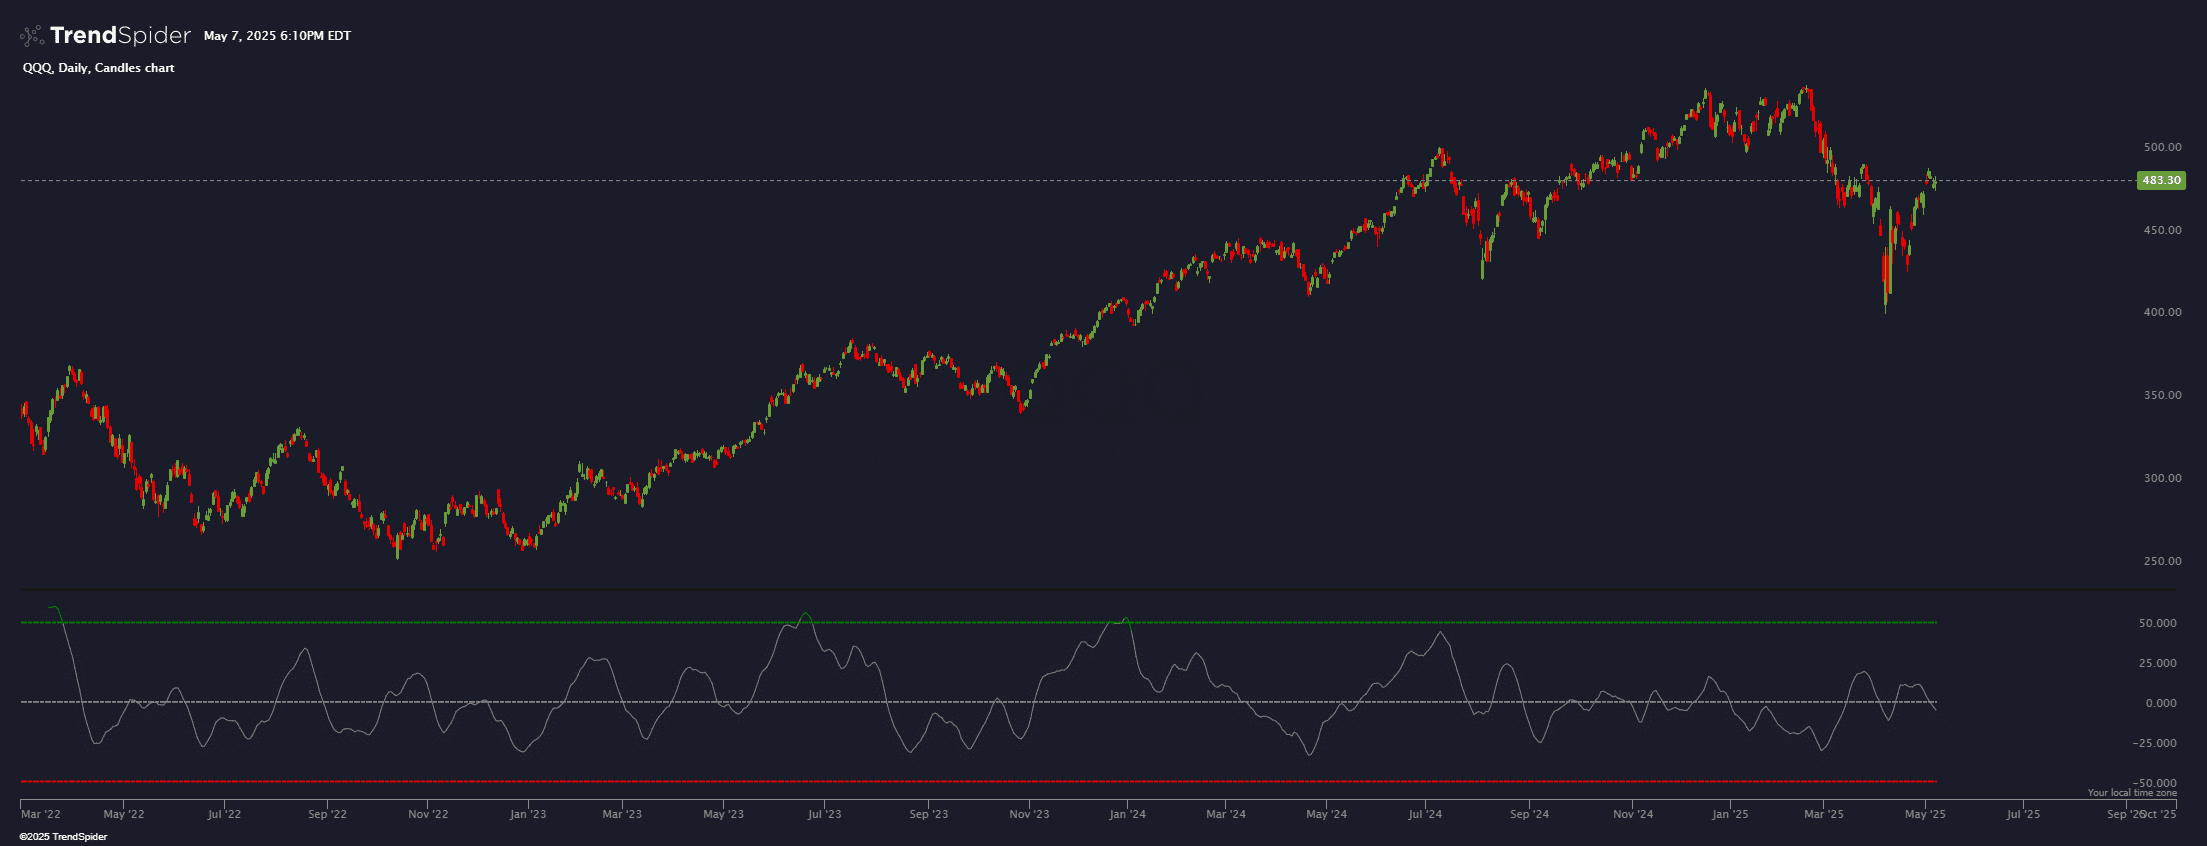
The Trend Strength Oscillator (TSO) combines ADX and RSI to measure both trend strength and overextension in a single indicator. ADX identifies when a trend is strong, while RSI detects potential exhaustion points.
Use Case:
Avoid weak breakouts by only trading when the trend is confirmed strong (ADX > 25).
Spot overbought/oversold extremes to avoid chasing extended moves.
Find high-probability entries by waiting for pullbacks in strong trends.
Use TSO divergence to detect early trend reversals.
This tool is ideal for momentum traders looking to balance trend confirmation with exhaustion signals for more precise entries and exits.
Source code
This indicator had been implemented by TrendSpider Team in JavaScript on TrendSpider. Check out the developer documentation to learn more about JS on TrendSpider.
describe_indicator('Trend Strength Oscillator (TSO)', 'lower');

// User-defined inputs
const adxPeriod = input.number('ADX Period', 14, { min: 1 });
const rsiPeriod = input.number('RSI Period', 14, { min: 1 });
const smoothingPeriod = input.number('TSO Smoothing Period', 5, { min: 1 });

// Calculate ADX and RSI
const myAdx = indicators.adx(adxPeriod);
const myRsi = rsi(close, rsiPeriod);

// Calculate TSO
const rawTso = for_every(myAdx.adx, myRsi, (a, r) => {
    const adxComponent = (a - 25) / 75 * 100;
    const rsiComponent = r - 50;
    return adxComponent + rsiComponent;
});

// Smooth TSO
const smoothedTso = sma(rawTso, smoothingPeriod);

// Define colors for different conditions
const tsoColor = for_every(smoothedTso, t => {
    if (t > 50) return 'green';
    if (t < -50) return 'red';
    return 'gray';
});

// Paint TSO
paint(smoothedTso, { style: 'line', color: tsoColor, name: 'TSO' });

// Paint reference lines
paint(horizontal_line(50), { style: 'dotted', color: 'green', name: 'Overbought' });
paint(horizontal_line(-50), { style: 'dotted', color: 'red', name: 'Oversold' });

// Paint zero line
paint(horizontal_line(0), { style: 'dotted', color: 'gray', name: 'Zero Line' });

// Register signals for potential use in alerts or strategies
register_signal(for_every(smoothedTso, t => t > 50), 'Bullish Trend Overextension');
register_signal(for_every(smoothedTso, t => t < -50), 'Bearish Trend Overextension');