Seasonality Overlay
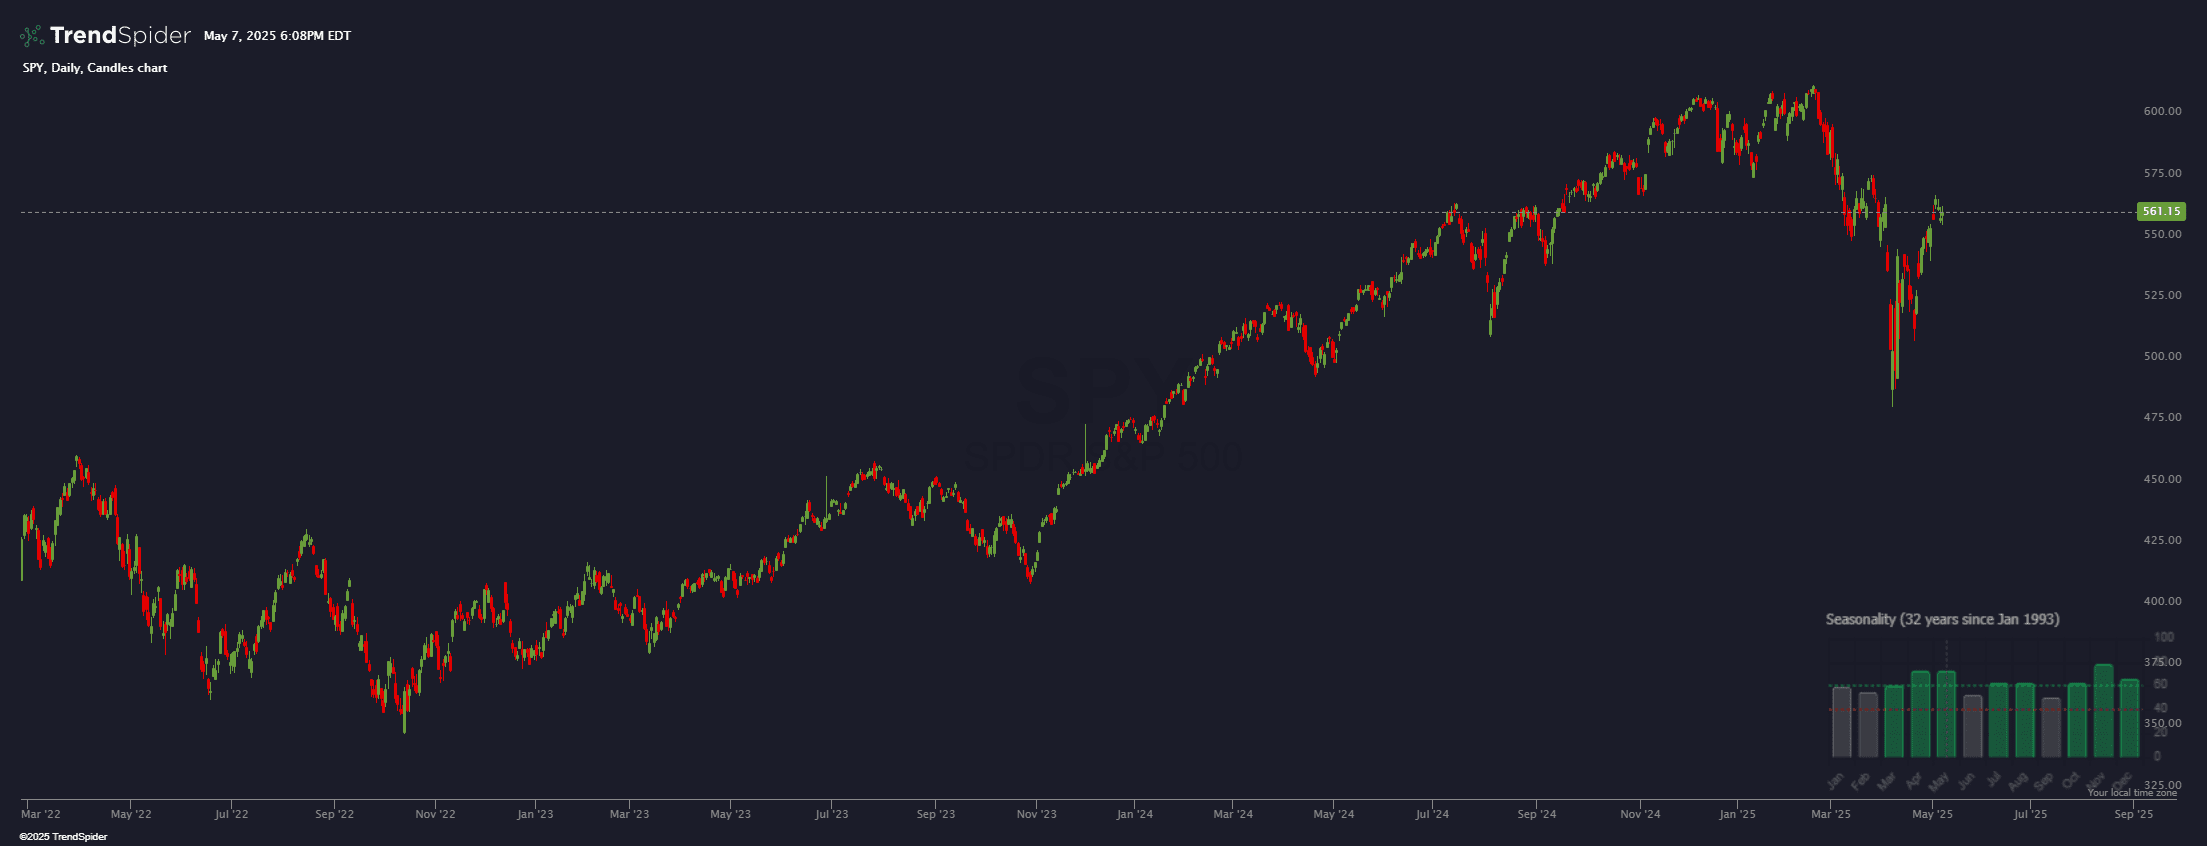
Visualizes historical monthly performance trends for a given asset. It calculates the percentage of winning periods for each month based on past price changes and categorizes them using a color-coded system—green for strong seasonal trends, gray for neutral, and red for weak trends. A bar chart displays these probabilities, helping traders quickly identify favorable or unfavorable seasonal patterns.
Source code
This indicator had been implemented by TrendSpider Team in JavaScript on TrendSpider. Check out the developer documentation to learn more about JS on TrendSpider.
describe_indicator('Seasonality Overlay');
const moment = library('moment-timezone');
const tinycolor = library('tinycolor2');
const jstat = library('jstat');

const data = await request.seasonality(current.ticker, 'monthly', 'change');
assert(!data.error, data.error);

const COLOR_SUCCESS = '#12d962';
const LEVEL_SUCCESS = 60;

const COLOR_FAILURE = 'red';
const LEVEL_FAILURE = 40;

const COLORS_BY_WINP = [{
	from: LEVEL_SUCCESS,
	color: COLOR_SUCCESS
}, {
	from: LEVEL_FAILURE,
	color: 'gray'
}, {
	from: 0,
	color: COLOR_FAILURE
}];


const percentageOfWinningPeriods = periodId => 100 * data.dataByCategory[periodId].filter(record => record.value > 0).length / data.dataByCategory[periodId].length;

const winPData = data.categories.map(percentageOfWinningPeriods);
const columnColors = winPData.map(winPercent => COLORS_BY_WINP.find(record => winPercent > record.from).color);

const currentCategory = moment(Date.now()).format('MMM');

paint_overlay('Table', { position: 'bottom_right' }, {
	rows: [{
		cells: [{
			text: `Seasonality (${moment(Date.now()).diff(moment(data.sinceDate * 1e3), 'years')} years since ${moment(data.sinceDate * 1e3).format('MMM YYYY')})`,
			color: 'var(--text-color)'
		}]
	}, {
		cells: [{
			chart: {
				width: '350px',
				height: '170px',
				type: 'bar',
				options: {
					devicePixelRatio: 2,
					scales: {
						y: { position: 'right', alignToPixels: true }
					},
					plugins: {
						legend: { display: false },
						annotation: {
							annotations: {
								line1: { type: 'line', yMin: LEVEL_SUCCESS, yMax: LEVEL_SUCCESS, borderColor: COLOR_SUCCESS, borderWidth: 1, borderDash: [3] },
								line2: { type: 'line', yMin: LEVEL_FAILURE, yMax: LEVEL_FAILURE, borderColor: COLOR_FAILURE, borderWidth: 1, borderDash: [3] },
								line3: { type: 'line', yMin: 0, yMax: 100, xMin: currentCategory, xMax: currentCategory, borderColor: 'blue', borderWidth: 1, borderDash: [3] }
							}
						}
					}
				},
				data: {
					labels: data.categories,
					datasets: [{
						label: 'Winning periods',
						data: winPData,
						backgroundColor: columnColors.map(color => tinycolor(color).setAlpha(0.3).toRgbString()),
						borderColor: columnColors,
						borderWidth: 1,
						borderRadius: {
							topLeft: 3,
							topRight: 3
						}
					}]
				}
			}
		}]
	}]
});
Automated technical analysis software. For traders, by traders.