Relative Performance Table
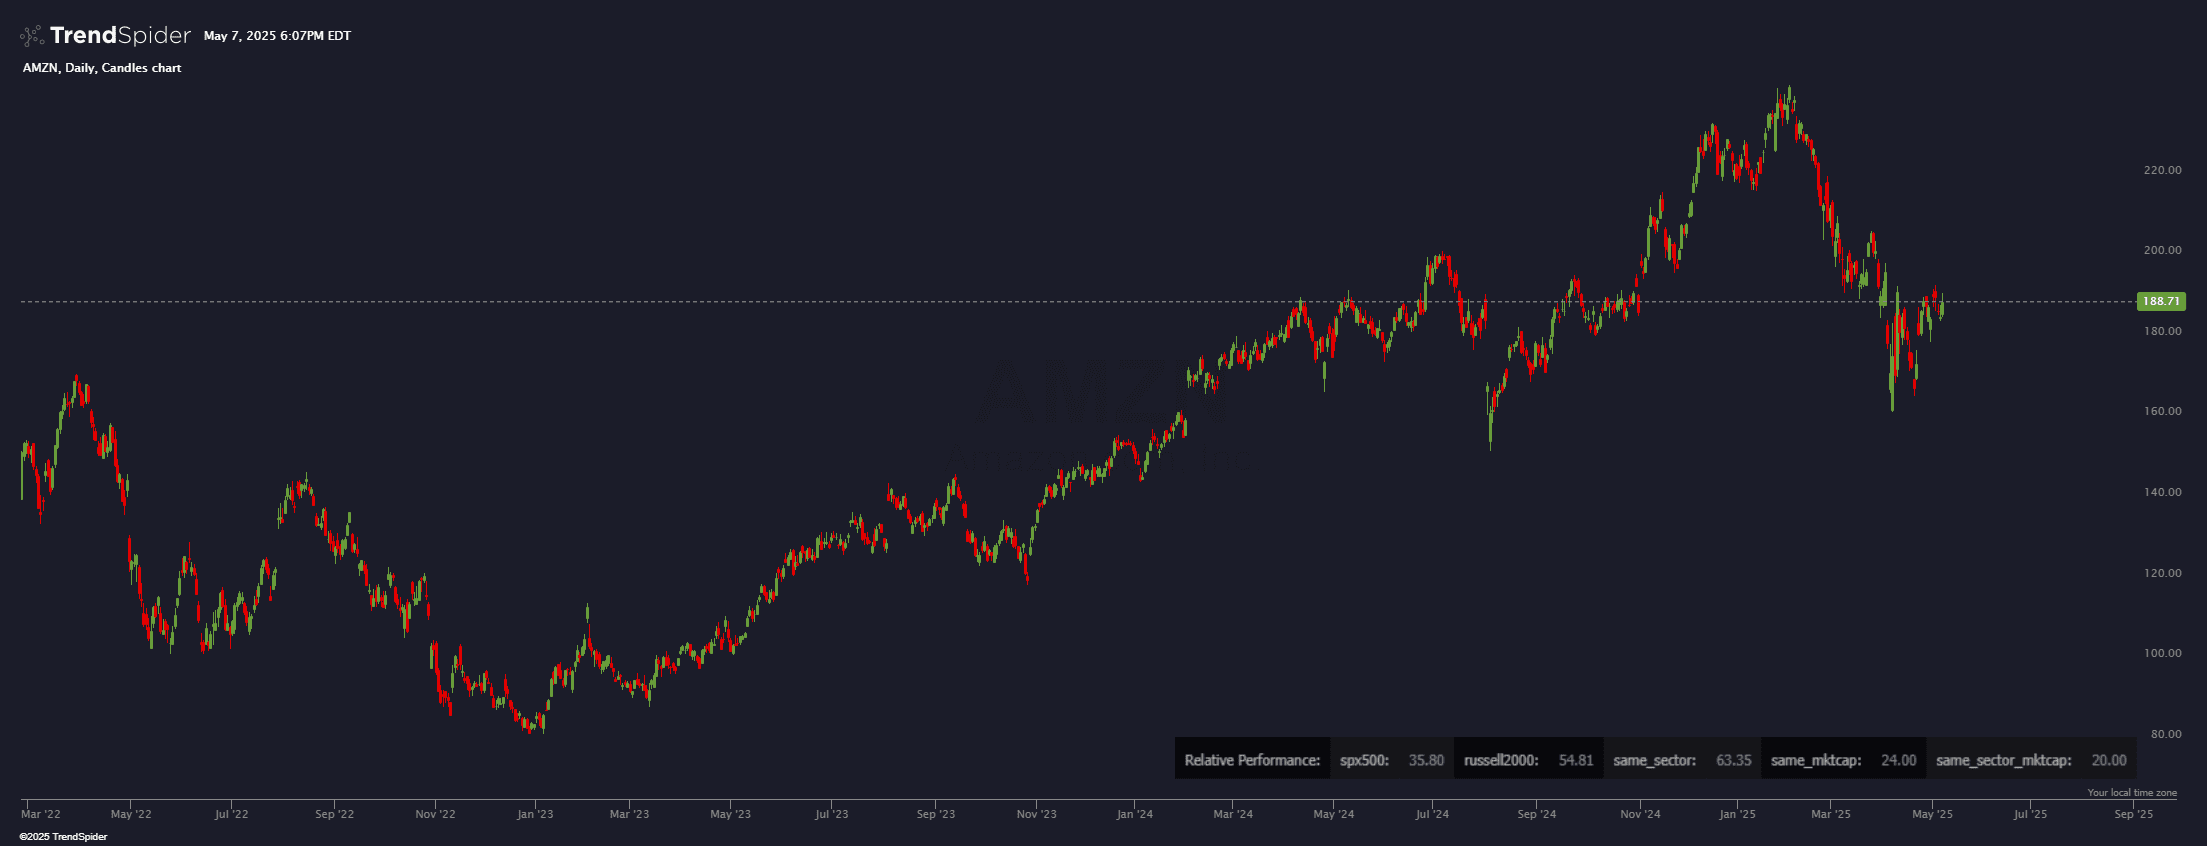
The Relative Performance Table ranks a stock’s TechRank (0-100) across key market groups:
S&P 500, Russell 2000, Sector, Market Cap, Sector & Market Cap
Color-Coded Scores:
🟢 >70: Outperforming
🔴 <20: Underperforming
⚪ 20-70: Neutral
Displayed as an overlay, this tool helps traders spot strength, weakness, and relative performance at a glance.
Source code
This indicator had been implemented by TrendSpider Team in JavaScript on TrendSpider. Check out the developer documentation to learn more about JS on TrendSpider.
describe_indicator('Relative Performance Table');

const moment = library('moment-timezone');
const tinycolor = library('tinycolor2');

// This is an experiment based on the request. It may not work perfectly or make complete sense.

const universes = ['spx500', 'russell2000', 'same_sector', 'same_mktcap', 'same_sector_mktcap'];
const performanceType = 'techrank'; // Using 'techrank' as it provides a score between 0 and 100

const performanceData = {};
for (const universe of universes) {
    const data = await request.relative_performance(current.ticker, performanceType, universe);
    assert(!data.error, `Error fetching data for ${universe}: ${data.error}`);
    performanceData[universe] = data[data.length - 1][1]; // Get the most recent score
}

const getColor = (value) => {
    if (value > 70) return '#12d962'; // Green
    if (value < 20) return 'red';
    return 'gray';
};

const cells = universes.flatMap((universe, index) => [
    {
        text: `${universe}:`,
        color: 'var(--text-color)', // Keep index names grey
        background: index % 2 === 0 ? 'rgba(255,255,255,0.05)' : 'transparent',
        padding: '10px 10px', // Increased vertical padding by 5px
        border: { width: 1, color: 'white' } // Add white border to each cell
    },
    {
        text: performanceData[universe].toFixed(2),
        color: getColor(performanceData[universe]),
        background: index % 2 === 0 ? 'rgba(255,255,255,0.05)' : 'transparent',
        padding: '10px 10px', // Increased vertical padding by 5px
        border: { width: 1, color: 'white' } // Add white border to each cell
    }
]);

paint_overlay('RelativePerformanceTable', { position: 'bottom_right', offset_x: -40, offset_y: -20, order: 'above_all' }, {
    rows: [
        {
            cells: [
                {
                    text: `Relative Performance: `,
                    color: 'var(--text-color)',
                    padding: '10px 10px', // Increased vertical padding by 5px
                    border: { width: 1, color: 'white' } // Add white border to the header cell
                },
                ...cells
            ]
        }
    ],
    border: {
        width: 2,
        color: 'white',
        radius: 5
    },
    background: 'rgba(0,0,0,0.7)',
    cellSpacing: 2
});
Automated technical analysis software. For traders, by traders.