Volatility-Based Stop Loss
This indicator provides dynamic stop-loss levels based on market volatility, helping traders identify potential exit points in trending markets. It uses the Average True Range (ATR) as the foundation for calculating stop levels.
Key Features:
ATR-Based Stop Levels: Calculates stop-loss levels as a multiple of the ATR, adjusting dynamically with market volatility.
Uptrend & Downtrend Logic:
Uptrend: Stop level rises but never decreases, ensuring protection of profits.
Downtrend: Stop level falls but never increases, minimizing losses.
Customizable Inputs:
ATR Length: Defines the period for ATR calculation.
ATR Multiplier: Determines the distance of the stop-loss from the current price.
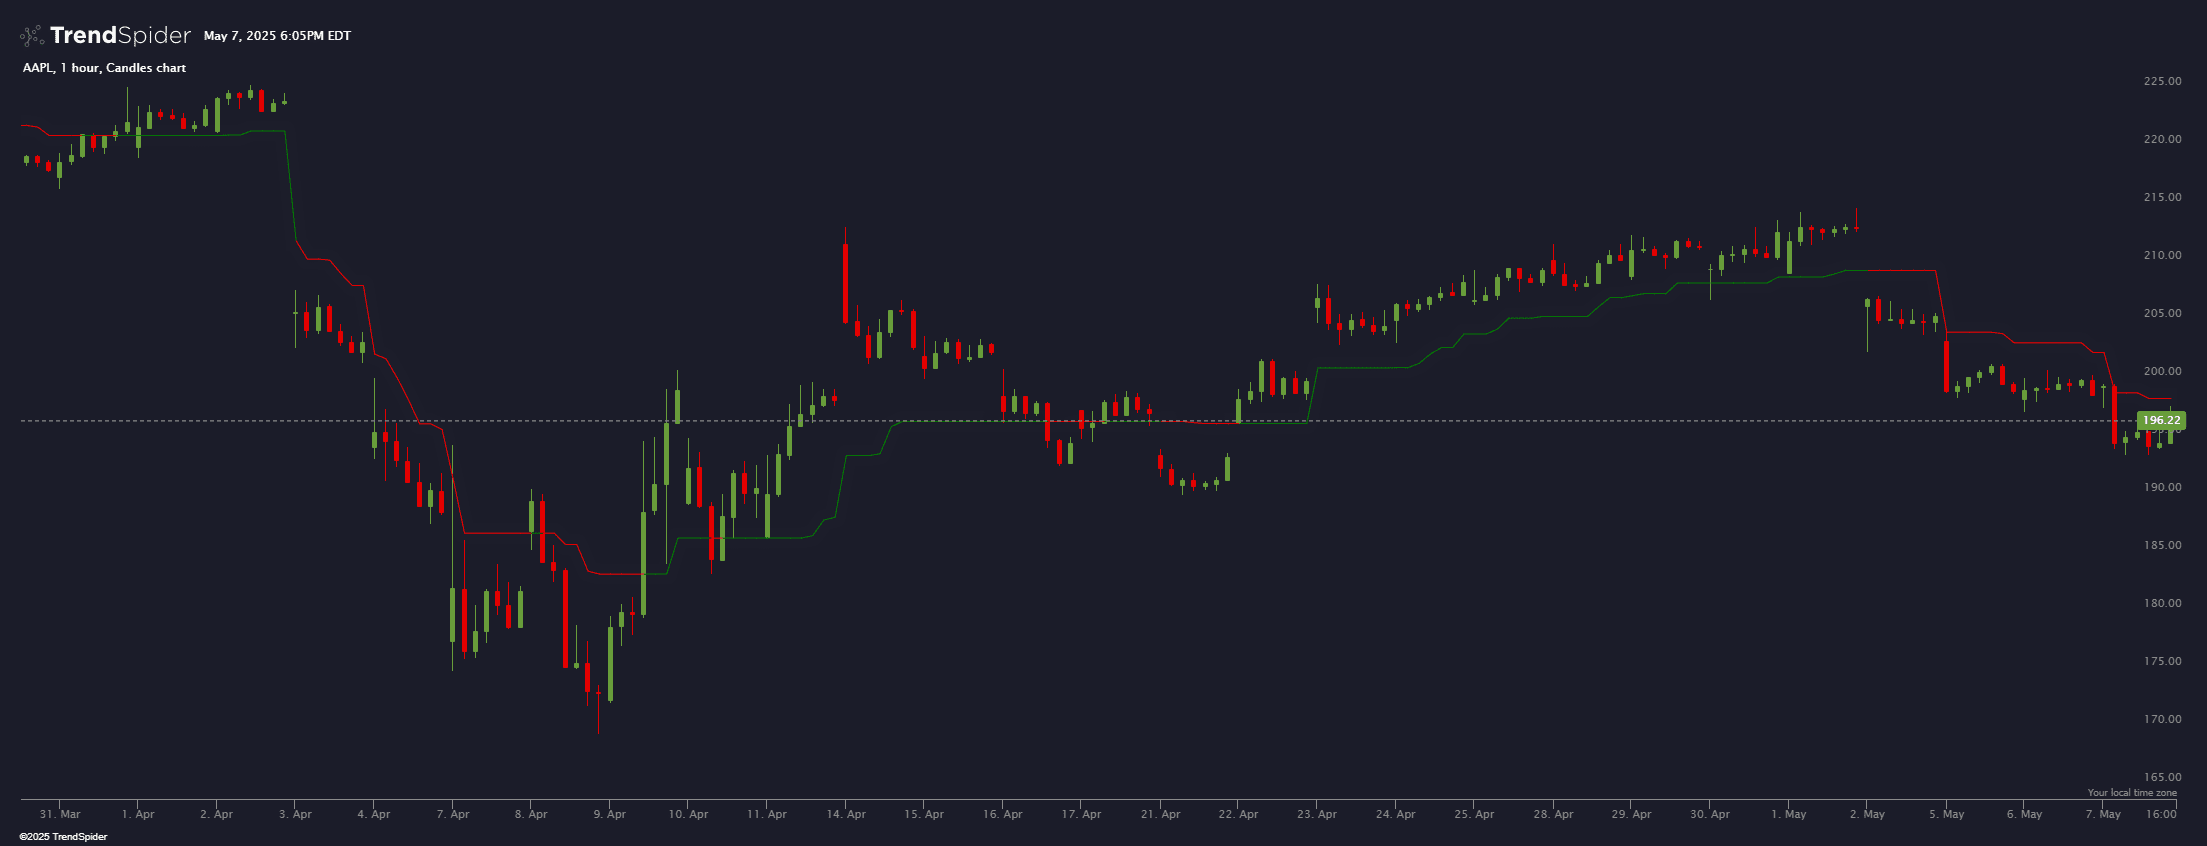
Visual Guide: Stop-loss levels are painted on the chart with:
Green Line: Indicates a bullish trend.
Red Line: Indicates a bearish trend.
Trend Adaptation: Adjusts dynamically to both trending and volatile market conditions.
Usage Note:
This experimental indicator is a visual tool to guide exit decisions in trending markets. It’s recommended to combine it with other analysis methods for robust trading strategies.
Source code
This indicator had been implemented by TrendSpider Team in JavaScript on TrendSpider. Check out the developer documentation to learn more about JS on TrendSpider.
describe_indicator('Volatility-Based Stop Loss');

// This is an experimental indicator based on the given request.
// It's designed to provide a visual guide for potential exit points
// in trending markets, but please use it with caution and in conjunction
// with other analysis methods.

const length = input.number('ATR Length', 14, { min: 1 });
const multiplier = input.number('ATR Multiplier', 2, { min: 0.1, step: 0.1 });

const myAtr = atr(length);
const stopLoss = series_of(null);

for_every(close, myAtr, (c, a, prev, i) => {
    if (i === 0) {
        stopLoss[i] = c - a * multiplier;
    } else {
        const prevStop = stopLoss[i - 1];
        if (c > prevStop) {
            // In an uptrend
            stopLoss[i] = Math.max(c - a * multiplier, prevStop);
        } else {
            // In a downtrend
            stopLoss[i] = Math.min(c + a * multiplier, prevStop);
        }
    }
});

const stopColor = for_every(close, stopLoss, (c, s) =>
    c > s ? 'green' : 'red'
);

paint(stopLoss, {
    name: 'Volatility Stop',
    color: stopColor,
    style: 'line',
    linewidth: 2
});