Multi-Timeframe Moving Average
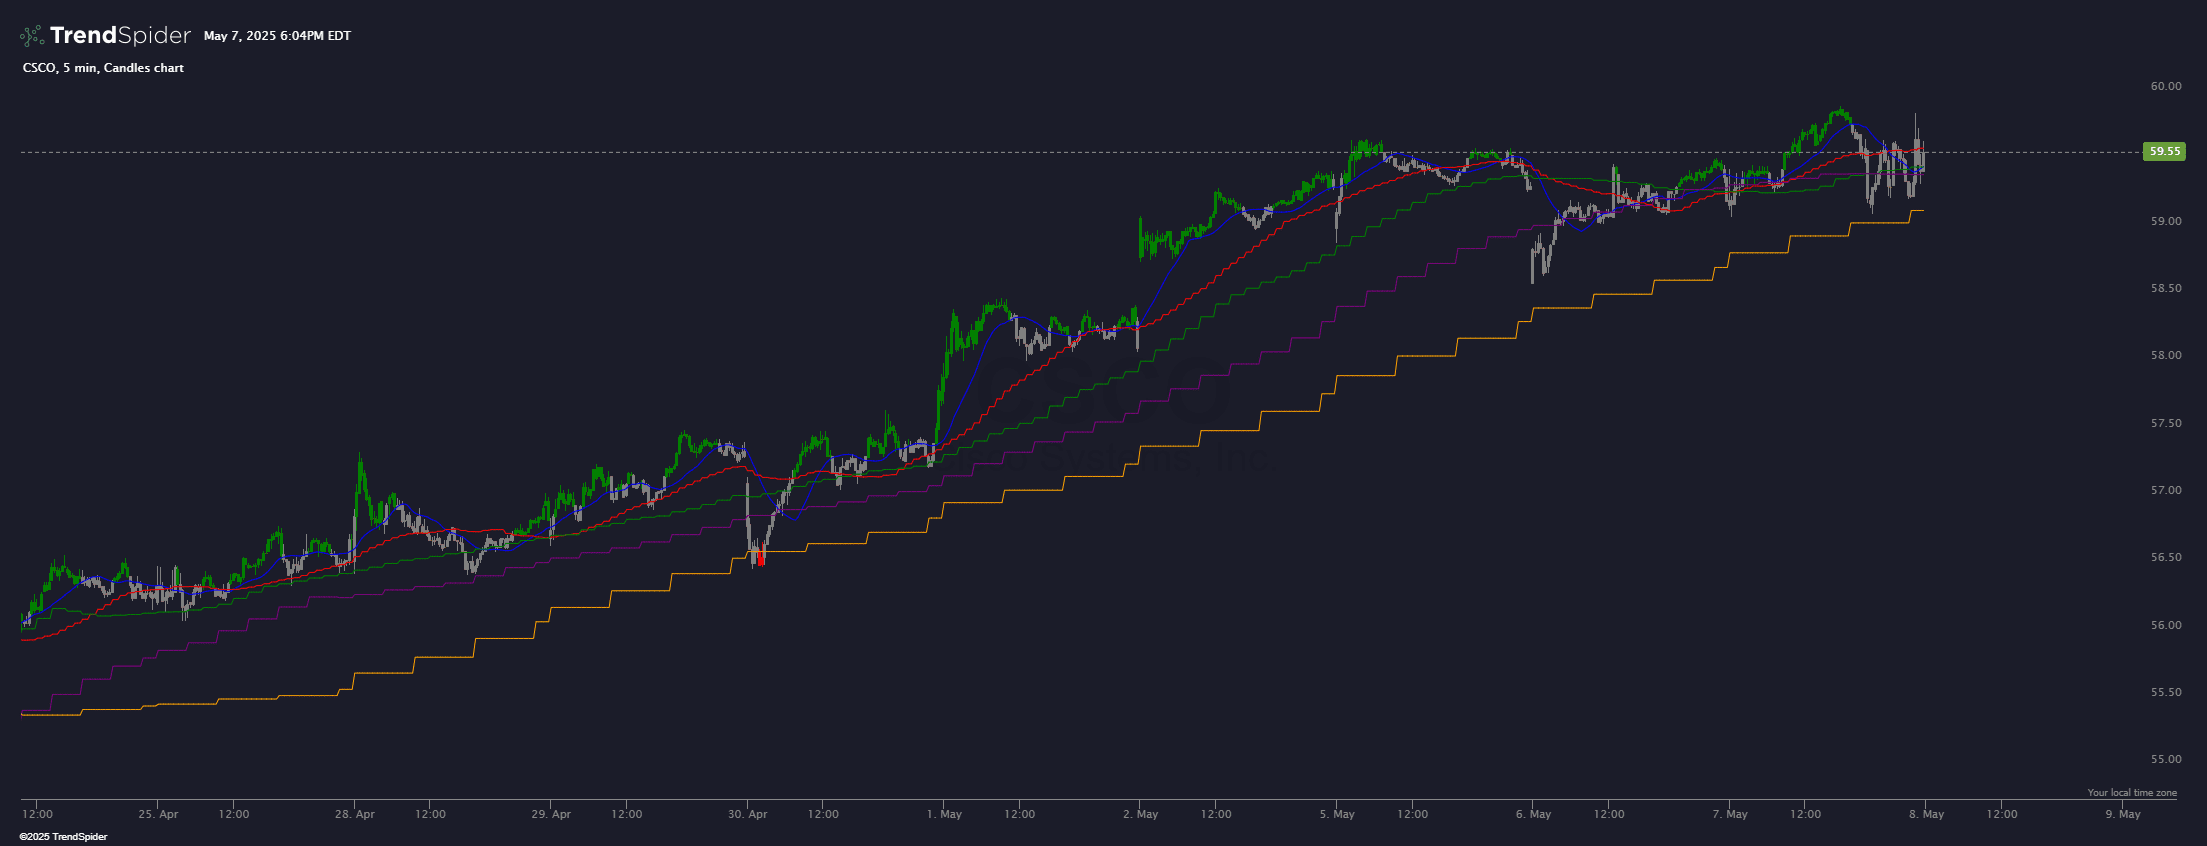
This indicator identifies 5 timeframes of the same moving average length and style and paints candles based on their location relative to all five moving averages. If a candle opens and closes above all moving averages, candles are painted green. If a candle opens and closes below all moving averages, candles are painted red. All other candles are painted grey.
Source code
This indicator had been implemented by TrendSpider Team in JavaScript on TrendSpider. Check out the developer documentation to learn more about JS on TrendSpider.
describe_indicator('Multi-Timeframe Moving Average');

// This indicator colors candles based on their position relative to multiple timeframe MAs.
// You can define the time frames, moving average length, and moving average type.
// It also generates signals for red and green candles.

// Define the moving average length
const myMaLength = input.number('MA Length', 20, { min: 1 });

// Define the moving average type
const myMaType = input.select('MA Type', 'sma', constants.ma_types);

// Define the 5 time frames
const myTf1 = input.select('Timeframe 1', '5', constants.time_frames);
const myTf2 = input.select('Timeframe 2', '15', constants.time_frames);
const myTf3 = input.select('Timeframe 3', '30', constants.time_frames);
const myTf4 = input.select('Timeframe 4', '60', constants.time_frames);
const myTf5 = input.select('Timeframe 5', '120', constants.time_frames);

// Toggle switches for each moving average
const myShowMa1 = input.boolean('Show MA 1', true);
const myShowMa2 = input.boolean('Show MA 2', true);
const myShowMa3 = input.boolean('Show MA 3', true);
const myShowMa4 = input.boolean('Show MA 4', true);
const myShowMa5 = input.boolean('Show MA 5', true);

// Function to fetch data, calculate MA, and prepare it for painting
const calculateMA = async (_timeframe) => {
    const myData = await request.history(current.ticker, _timeframe);
    assert(!myData.error, `Error fetching data for ${_timeframe} timeframe: ${myData.error}`);
    const myMa = indicators[myMaType](myData.close, myMaLength);
    const myMaLanded = land_points_onto_series(myData.time, myMa, time, 'le');
    return interpolate_sparse_series(myMaLanded, 'constant');
};

// Calculate MAs for all timeframes
const myMa1 = await calculateMA(myTf1);
const myMa2 = await calculateMA(myTf2);
const myMa3 = await calculateMA(myTf3);
const myMa4 = await calculateMA(myTf4);
const myMa5 = await calculateMA(myTf5);

// Determine candle colors based on their position relative to all MAs
const myCandleColors = for_every(open, close, myMa1, myMa2, myMa3, myMa4, myMa5,
    (_open, _close, _ma1, _ma2, _ma3, _ma4, _ma5) => {
    const maValues = [_ma1, _ma2, _ma3, _ma4, _ma5];

    if (maValues.every(ma => _open > ma && _close > ma)) {
        return 'green';
    } else if (maValues.every(ma => _open < ma && _close < ma)) {
        return 'red';
    } else {
        return 'gray';
    }
});

// Color the candles
color_candles(myCandleColors);

// Paint the moving averages
if (myShowMa1) paint(myMa1, { color: 'blue', name: `MA ${myTf1}` });
if (myShowMa2) paint(myMa2, { color: 'red', name: `MA ${myTf2}` });
if (myShowMa3) paint(myMa3, { color: 'green', name: `MA ${myTf3}` });
if (myShowMa4) paint(myMa4, { color: 'purple', name: `MA ${myTf4}` });
if (myShowMa5) paint(myMa5, { color: 'orange', name: `MA ${myTf5}` });

// Generate signals for red and green candles
const myGreenSignal = for_every(myCandleColors, _color => _color === 'green' ? 1 : 0);
const myRedSignal = for_every(myCandleColors, _color => _color === 'red' ? 1 : 0);
register_signal(myGreenSignal, "Green Candle Signal");
register_signal(myRedSignal, "Red Candle Signal");
Automated technical analysis software. For traders, by traders.