Bollinger Band Momentum
This indicator combines Bollinger Bands and the MACD histogram to identify momentum-based breakouts and breakdowns:
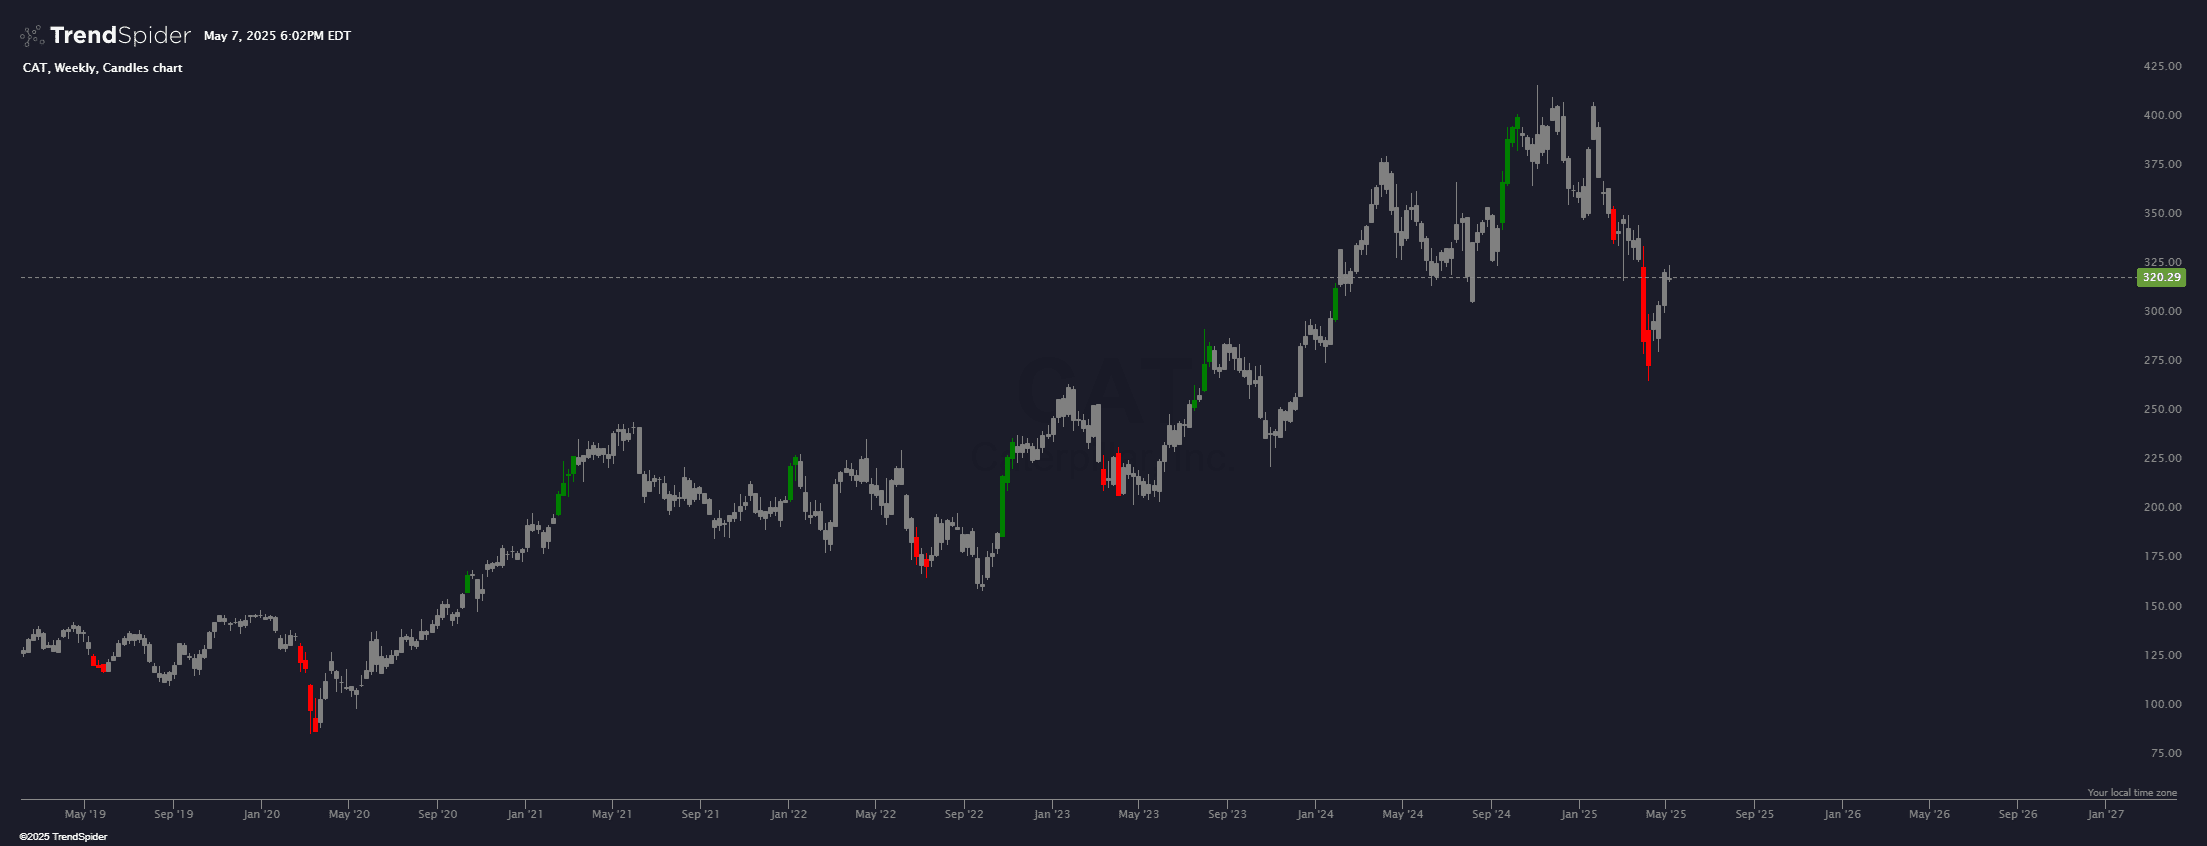
Green Candles: Price closes above the upper Bollinger Band, and the MACD histogram is positive, signaling bullish momentum.
Red Candles: Price closes below the lower Bollinger Band, and the MACD histogram is negative, signaling bearish momentum.
Grey Candles: Neutral conditions when neither signal is present.
It’s perfect for quickly spotting strong momentum shifts and potential trade opportunities at key price levels.
Source code
This indicator had been implemented by TrendSpider Team in JavaScript on TrendSpider. Check out the developer documentation to learn more about JS on TrendSpider.
describe_indicator('Bollinger Band Momentum');

// This indicator combines Bollinger Bands and MACD histogram to generate
// momentum-based signals. It's an experimental approach and may not guarantee
// accurate trading signals. Please use with caution and always backtest
// before using in live trading.

// Bollinger Bands inputs
const bbPeriod = input.number('BB Period', 20, { min: 1 });
const bbDeviation = input.number('BB Deviation', 2, { min: 0.1, step: 0.1 });

// MACD inputs
const macdFastPeriod = input.number('MACD Fast Period', 12, { min: 1 });
const macdSlowPeriod = input.number('MACD Slow Period', 26, { min: 1 });
const macdSignalPeriod = input.number('MACD Signal Period', 9, { min: 1 });

// Color inputs
const bullishColor = input.color('Bullish Color', 'green');
const bearishColor = input.color('Bearish Color', 'red');
const neutralColor = input.color('Neutral Color', 'grey');

// Calculate Bollinger Bands
const bbMA = sma(close, bbPeriod);
const bbStdDev = stdev(close, bbPeriod);
const bbUpper = add(bbMA, mult(bbStdDev, bbDeviation));
const bbLower = sub(bbMA, mult(bbStdDev, bbDeviation));

// Calculate MACD
const macdFast = ema(close, macdFastPeriod);
const macdSlow = ema(close, macdSlowPeriod);
const macdLine = sub(macdFast, macdSlow);
const signalLine = ema(macdLine, macdSignalPeriod);
const macdHistogram = sub(macdLine, signalLine);

// Generate signals and color candles
const candleColors = for_every(close, bbUpper, bbLower, macdHistogram, (_close, _bbUpper, _bbLower, _macdHistogram) => {
    if (_close > _bbUpper && _macdHistogram > 0) {
        return bullishColor;
    } else if (_close < _bbLower && _macdHistogram < 0) {
        return bearishColor;
    } else {
        return neutralColor;
    }
});

// Paint candles
color_candles(candleColors);

// Register signals for potential use in alerts or further analysis
register_signal(for_every(close, bbUpper, macdHistogram, (_close, _bbUpper, _macdHistogram) =>
    _close > _bbUpper && _macdHistogram > 0), 'Bullish Signal');
register_signal(for_every(close, bbLower, macdHistogram, (_close, _bbLower, _macdHistogram) =>
    _close < _bbLower && _macdHistogram < 0), 'Bearish Signal');
Automated technical analysis software. For traders, by traders.