Stochastic + RSI Volume
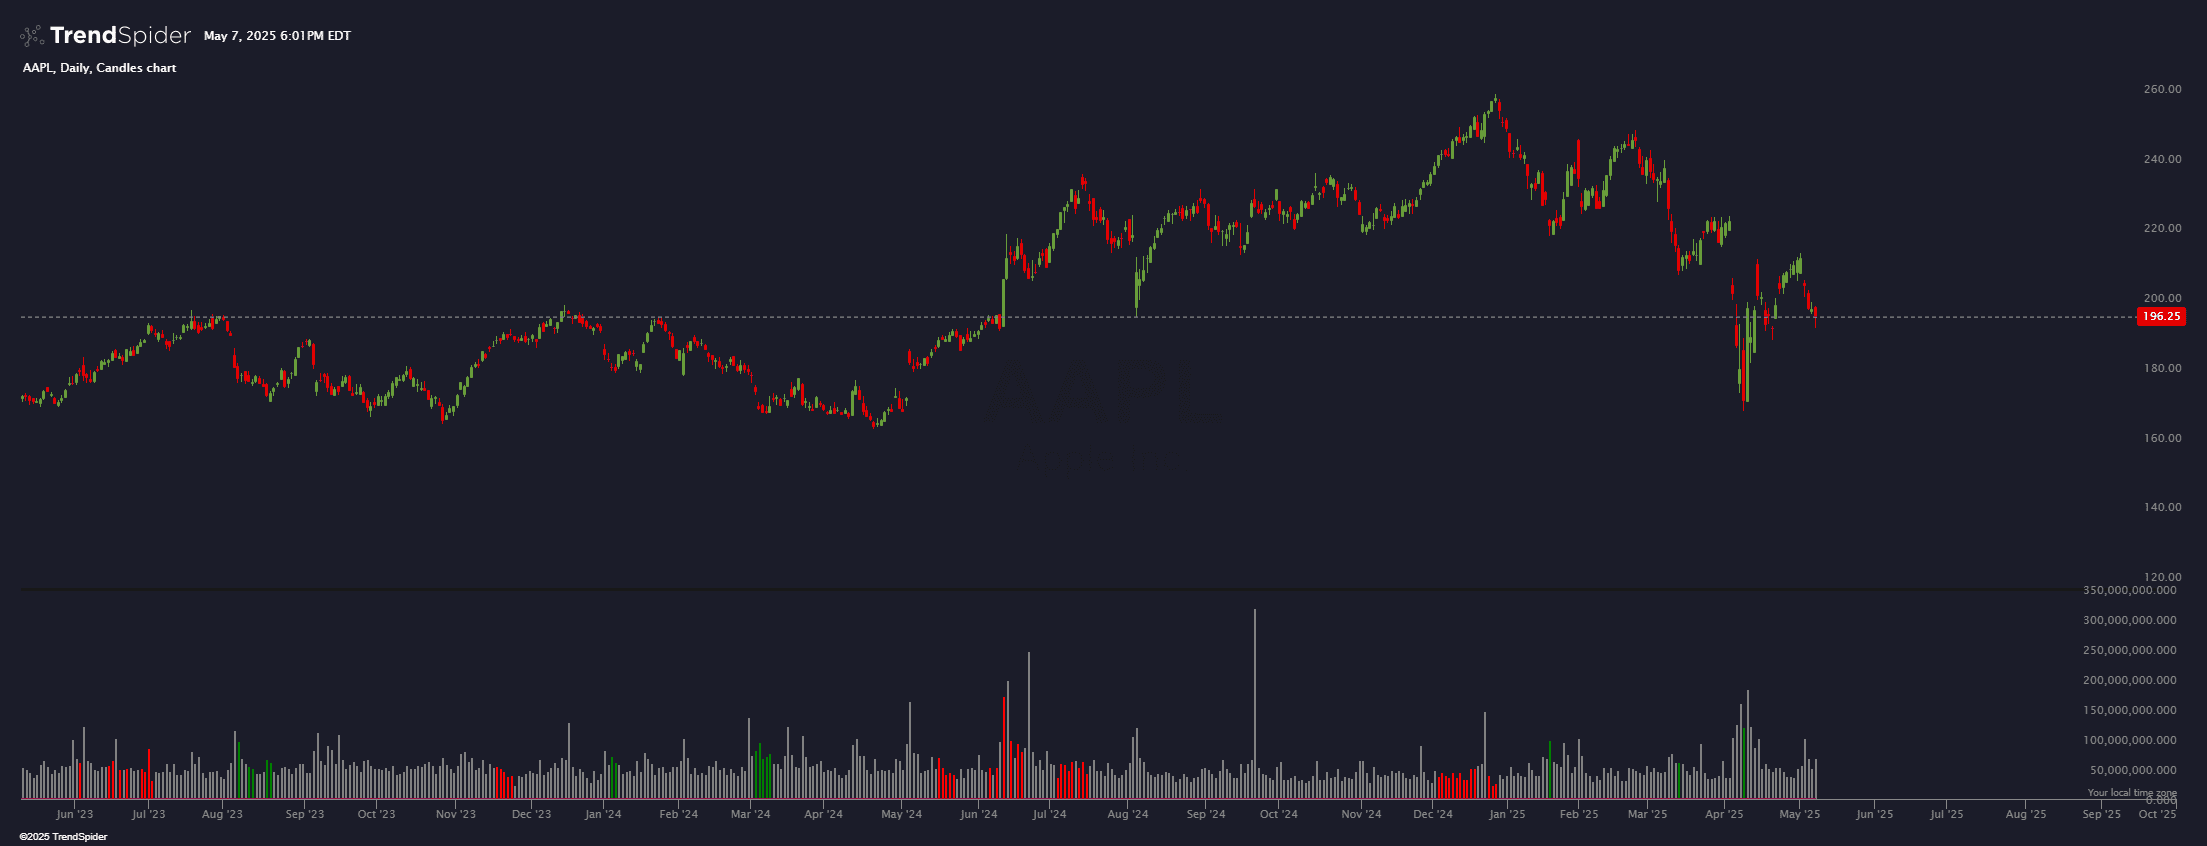
This indicator uses the volume histogram to highlight candles on which Stochastic D & K and RSI are all overbought or oversold. When Stochastics and RSI are overbought, the volume histogram is colored red. When Stochastics and RSI are oversold, the volume histogram is colored green.
Source code
This indicator had been implemented by TrendSpider Team in JavaScript on TrendSpider. Check out the developer documentation to learn more about JS on TrendSpider.
describe_indicator('Stochastic + RSI Volume', 'lower');

// RSI parameters
const rsiLength = input.number('RSI Length', 14, { min: 1 });
const rsiOverbought = input.number('RSI Overbought', 70, { min: 50, max: 100 });
const rsiOversold = input.number('RSI Oversold', 30, { min: 0, max: 50 });

// Stochastic parameters
const stochLength = input.number('Stochastic Length', 14, { min: 1 });
const stochSmooth = input.number('Stochastic Smooth', 3, { min: 1 });
const stochOverbought = input.number('Stochastic Overbought', 80, { min: 50, max: 100 });
const stochOversold = input.number('Stochastic Oversold', 20, { min: 0, max: 50 });

// Calculate RSI
const myRsi = rsi(close, rsiLength);

// Calculate Stochastics
const myStoch = stochastic(close, high, low, stochLength);
const myStochK = sma(myStoch, stochSmooth);
const myStochD = sma(myStochK, stochSmooth);

// Define colors
const colorOversold = 'green';
const colorNeutral = 'grey';
const colorOverbought = 'red';

// Color the volume bars based on RSI and Stochastic conditions
const volumeColor = for_every(myRsi, myStochK, myStochD, (r, k, d) => {
    if (r <= rsiOversold && k <= stochOversold && d <= stochOversold) return colorOversold;
    if (r >= rsiOverbought && k >= stochOverbought && d >= stochOverbought) return colorOverbought;
    return colorNeutral;
});

// Paint the volume histogram
paint(volume, {
    name: 'Volume',
    color: volumeColor,
    style: 'column'
});

// Paint Stochastic lines for reference
paint(myStochK, { name: 'Stoch %K', color: 'blue' });
paint(myStochD, { name: 'Stoch %D', color: 'red' });

// Create signals for red and green volume bars
const oversoldSignal = for_every(myRsi, myStochK, myStochD, (r, k, d) =>
    r <= rsiOversold && k <= stochOversold && d <= stochOversold ? 1 : 0
);

const overboughtSignal = for_every(myRsi, myStochK, myStochD, (r, k, d) =>
    r >= rsiOverbought && k >= stochOverbought && d >= stochOverbought ? 1 : 0
);

register_signal(oversoldSignal, 'Oversold Volume');
register_signal(overboughtSignal, 'Overbought Volume');
Automated technical analysis software. For traders, by traders.