Triple RSI with Overbought/Oversold Shading
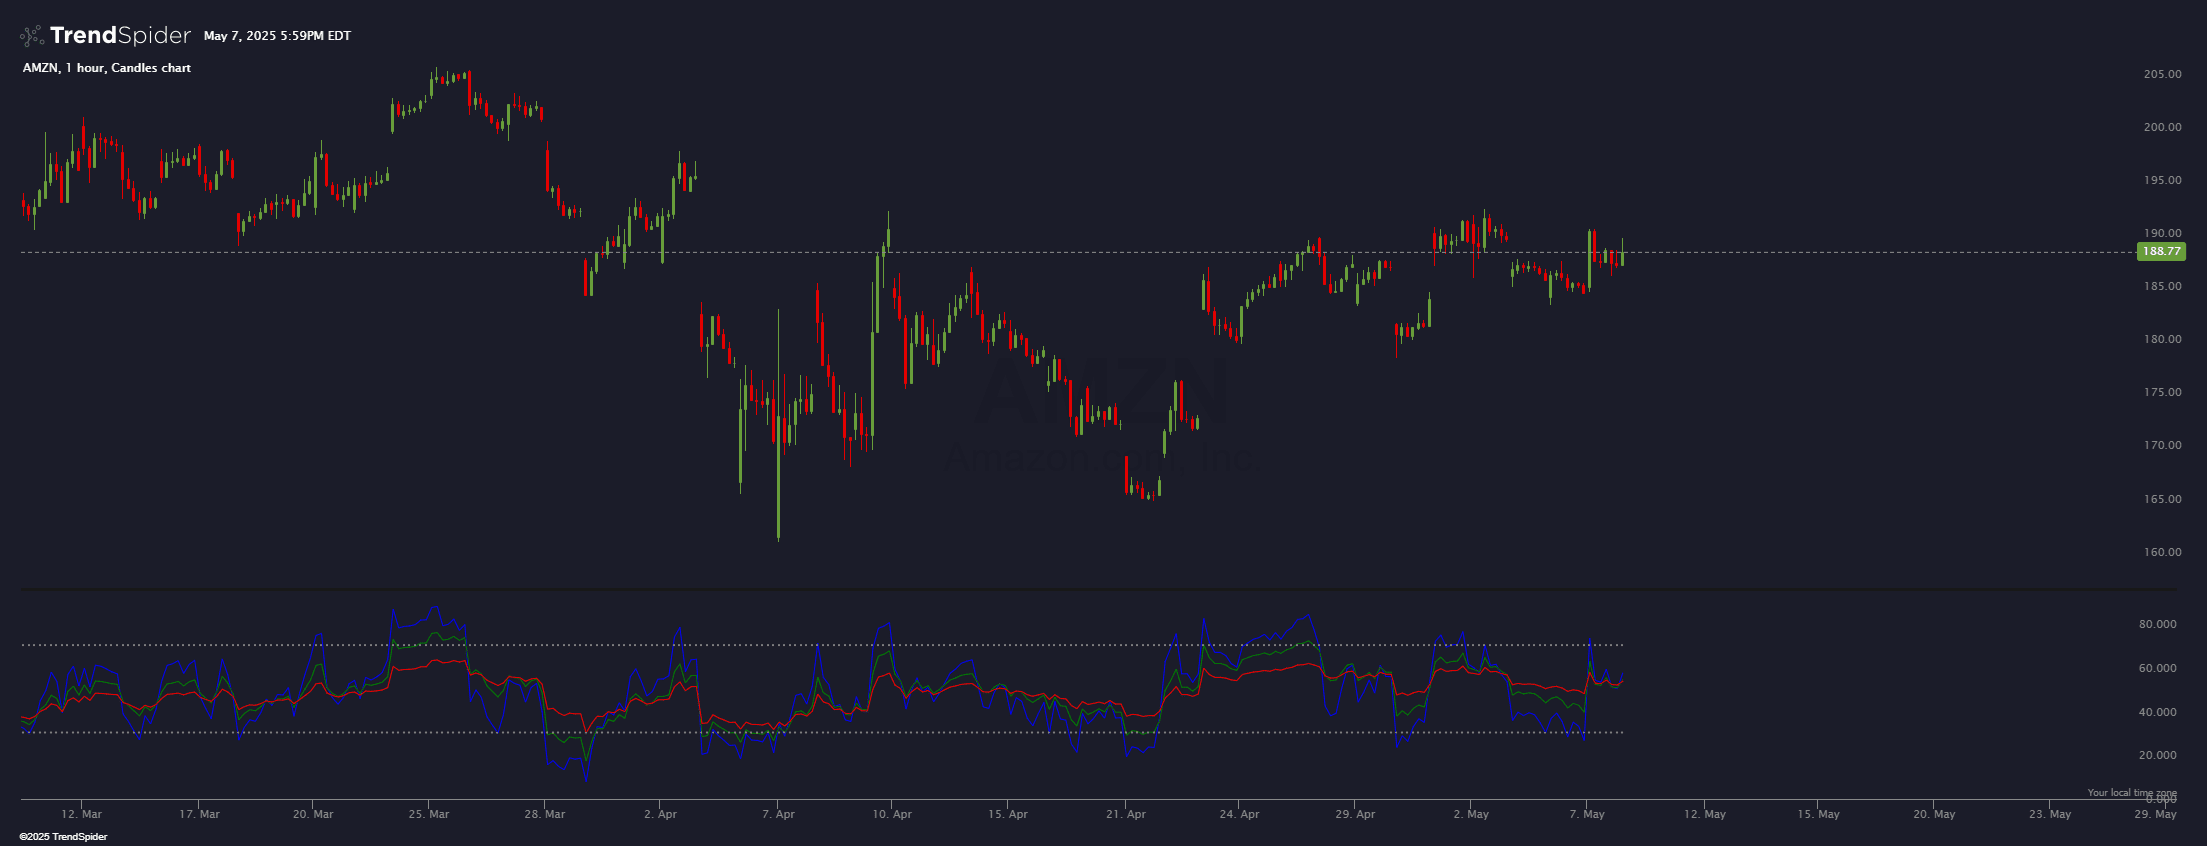
This indicator paints three RSI lengths (7, 14, and 28) and adds a red shading when all three lengths are overbought and a green shading when all three lengths are oversold.
Source code
This indicator had been implemented by TrendSpider Team in JavaScript on TrendSpider. Check out the developer documentation to learn more about JS on TrendSpider.
describe_indicator('Triple RSI with Overbought/Oversold Shading', 'lower');

// Define RSI lengths and overbought/oversold levels
const myLengths = [7, 14, 28];
const myOverboughtLevel = input.number('Overbought Level', 70, { min: 50, max: 100 });
const myOversoldLevel = input.number('Oversold Level', 30, { min: 0, max: 50 });

// Calculate RSIs
const myRsi7 = rsi(close, myLengths[0]);
const myRsi14 = rsi(close, myLengths[1]);
const myRsi28 = rsi(close, myLengths[2]);

// Function to check if all RSIs are above/below a certain level
const myAllRSIsAbove = (level) => for_every(myRsi7, myRsi14, myRsi28, (_r7, _r14, _r28) =>
    _r7 > level && _r14 > level && _r28 > level);
const myAllRSIsBelow = (level) => for_every(myRsi7, myRsi14, myRsi28, (_r7, _r14, _r28) =>
    _r7 < level && _r14 < level && _r28 < level);

// Create shading series
const myShadingSeries = for_every(myRsi7, myRsi14, myRsi28, (_r7, _r14, _r28) => {
    if (_r7 > myOverboughtLevel && _r14 > myOverboughtLevel && _r28 > myOverboughtLevel) return myOverboughtLevel;
    if (_r7 < myOversoldLevel && _r14 < myOversoldLevel && _r28 < myOversoldLevel) return myOversoldLevel;
    return null;
});

// Paint RSI lines
paint(myRsi7, { color: 'blue', name: 'RSI 7' });
paint(myRsi14, { color: 'green', name: 'RSI 14' });
paint(myRsi28, { color: 'red', name: 'RSI 28' });

// Paint overbought and oversold levels
paint(horizontal_line(myOverboughtLevel), { color: 'gray', style: 'dotted', name: 'Overbought' });
paint(horizontal_line(myOversoldLevel), { color: 'gray', style: 'dotted', name: 'Oversold' });

// Paint shading
const myShadingPainted = paint(myShadingSeries, { style: 'line', hidden: true });
fill(myShadingPainted, paint(horizontal_line(myOversoldLevel), { hidden: true }), 'red', 0.3, 'Overbought');
fill(paint(horizontal_line(myOverboughtLevel), { hidden: true }), myShadingPainted, 'green', 0.3, 'Oversold');

// Register signals
register_signal(myAllRSIsAbove(myOverboughtLevel), 'All Overbought');
register_signal(myAllRSIsBelow(myOversoldLevel), 'All Oversold');
Automated technical analysis software. For traders, by traders.