RSI with Seasonality
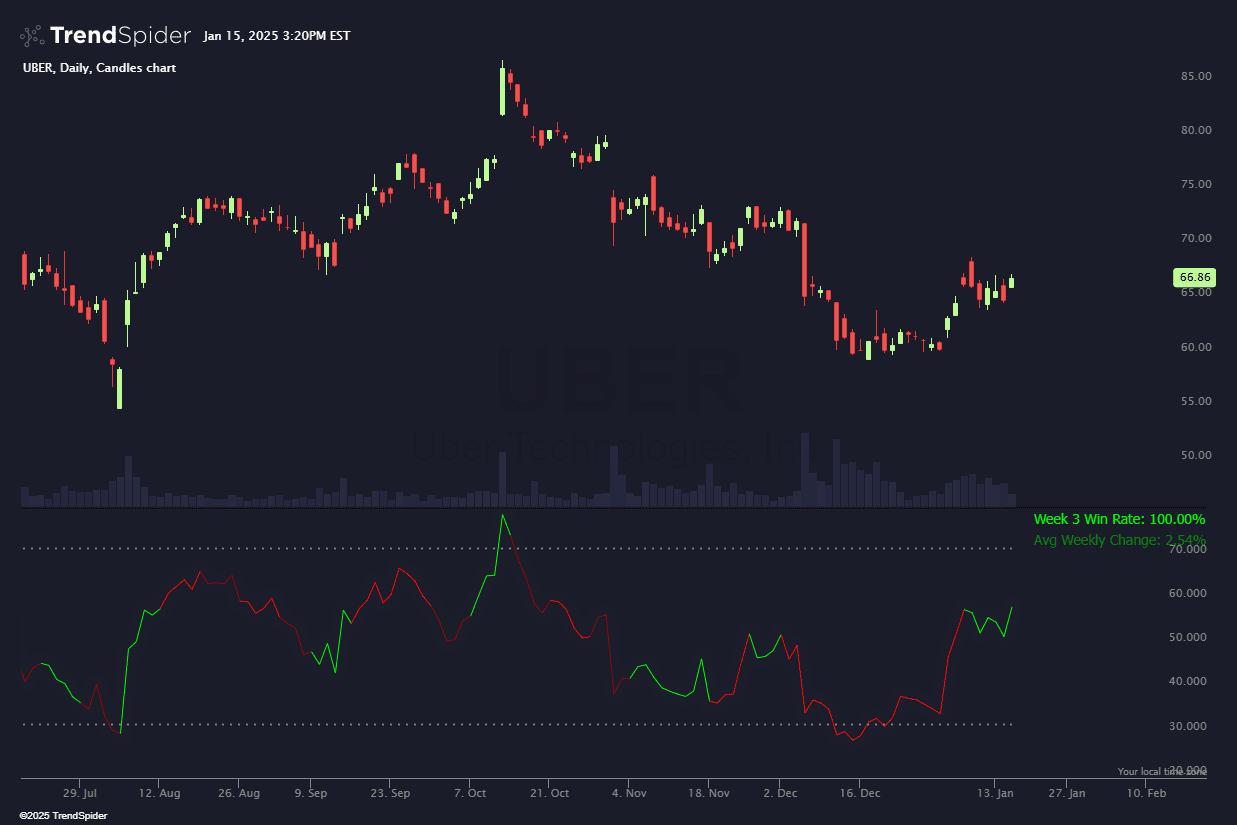
The RSI with Seasonality indicator combines traditional momentum analysis with seasonal insights, providing a powerful visualization tool for traders. The RSI line dynamically changes color each week based on the historical win rate for that specific week of the year, adding a layer of context that goes beyond standard momentum readings.
Source code
This indicator had been implemented by TrendSpider in JavaScript on TrendSpider. Check out the developer documentation to learn more about JS on TrendSpider.
describe_indicator('RSI with Seasonality', 'lower');

const moment = library('moment-timezone');

// Input parameters
const length = input.number('RSI Length', 14, { min: 1 });
const overboughtLevel = input.number('Overbought', 70, { min: 50, max: 100 });
const oversoldLevel = input.number('Oversold', 30, { min: 0, max: 50 });

// New inputs for scanner and strategy tester
const showWeekInfo = input.boolean('Show Week Info', true);
const customLineColor = input.color('RSI Line Color', '#FF0000');

// Fetch seasonality data
const seasonalityData = await request.seasonality(current.ticker, 'week_of_year', 'change');
assert(!seasonalityData.error, `Error fetching seasonality data: ${seasonalityData.error}`);

// Calculate RSI
const myRsi = rsi(close, length);

// Function to get seasonality data for a given week
const getSeasonalityForWeek = (weekNumber) => {
    const weekData = seasonalityData.dataByCategory[weekNumber];
    if (!weekData) return { winRate: 0, meanChange: 0 };

    const winRate = 100 * weekData.filter(record => record.value > 0).length / weekData.length;
    const meanChange = weekData.reduce((sum, record) => sum + record.value, 0) / weekData.length;

    return { winRate, meanChange };
};

// Function to get color based on win rate
const getColorForWinRate = (winRate) => {
    if (winRate > 65) return '#00FF00'; // Bright green
    if (winRate > 50) return '#008000'; // Green
    if (winRate > 35) return '#FF0000'; // Red
    return '#8B0000'; // Dark red
};

// Generate RSI color series
const rsiColor = showWeekInfo ? for_every(time, (t, i) => {
    const weekNumber = moment(t * 1000).isoWeek();
    const { winRate } = getSeasonalityForWeek(weekNumber);
    return getColorForWinRate(winRate);
}) : customLineColor;

// Paint RSI
paint(myRsi, { style: 'line', color: rsiColor, name: 'RSI' });

// Paint overbought and oversold levels
paint(horizontal_line(overboughtLevel), { color: 'gray', style: 'dotted' });
paint(horizontal_line(oversoldLevel), { color: 'gray', style: 'dotted' });

// Current week info for overlay
const currentWeek = moment().isoWeek();
const { winRate, meanChange } = getSeasonalityForWeek(currentWeek);

// Register signals for scanner and strategy tester
register_signal(for_every(myRsi, r => r > overboughtLevel), 'RSI Overbought');
register_signal(for_every(myRsi, r => r < oversoldLevel), 'RSI Oversold');
register_signal(series_of(winRate > 50), 'Positive Win Rate Week');
register_signal(series_of(meanChange > 0), 'Positive Mean Change Week');

// Paint overlay with current week info (only if showWeekInfo is true)
if (showWeekInfo) {
    paint_overlay('WeekInfo', { position: 'top_right' }, {
        rows: [{
            cells: [{
                text: `Week ${currentWeek} Win Rate: ${winRate.toFixed(2)}%`,
                color: getColorForWinRate(winRate)
            }]
        }, {
            cells: [{
                text: `Avg Weekly Change: ${(meanChange * 100).toFixed(2)}%`,
                color: meanChange > 0 ? 'green' : 'red'
            }]
        }]
    });
}
Automated technical analysis software. For traders, by traders.