2 RSIs Dynamic
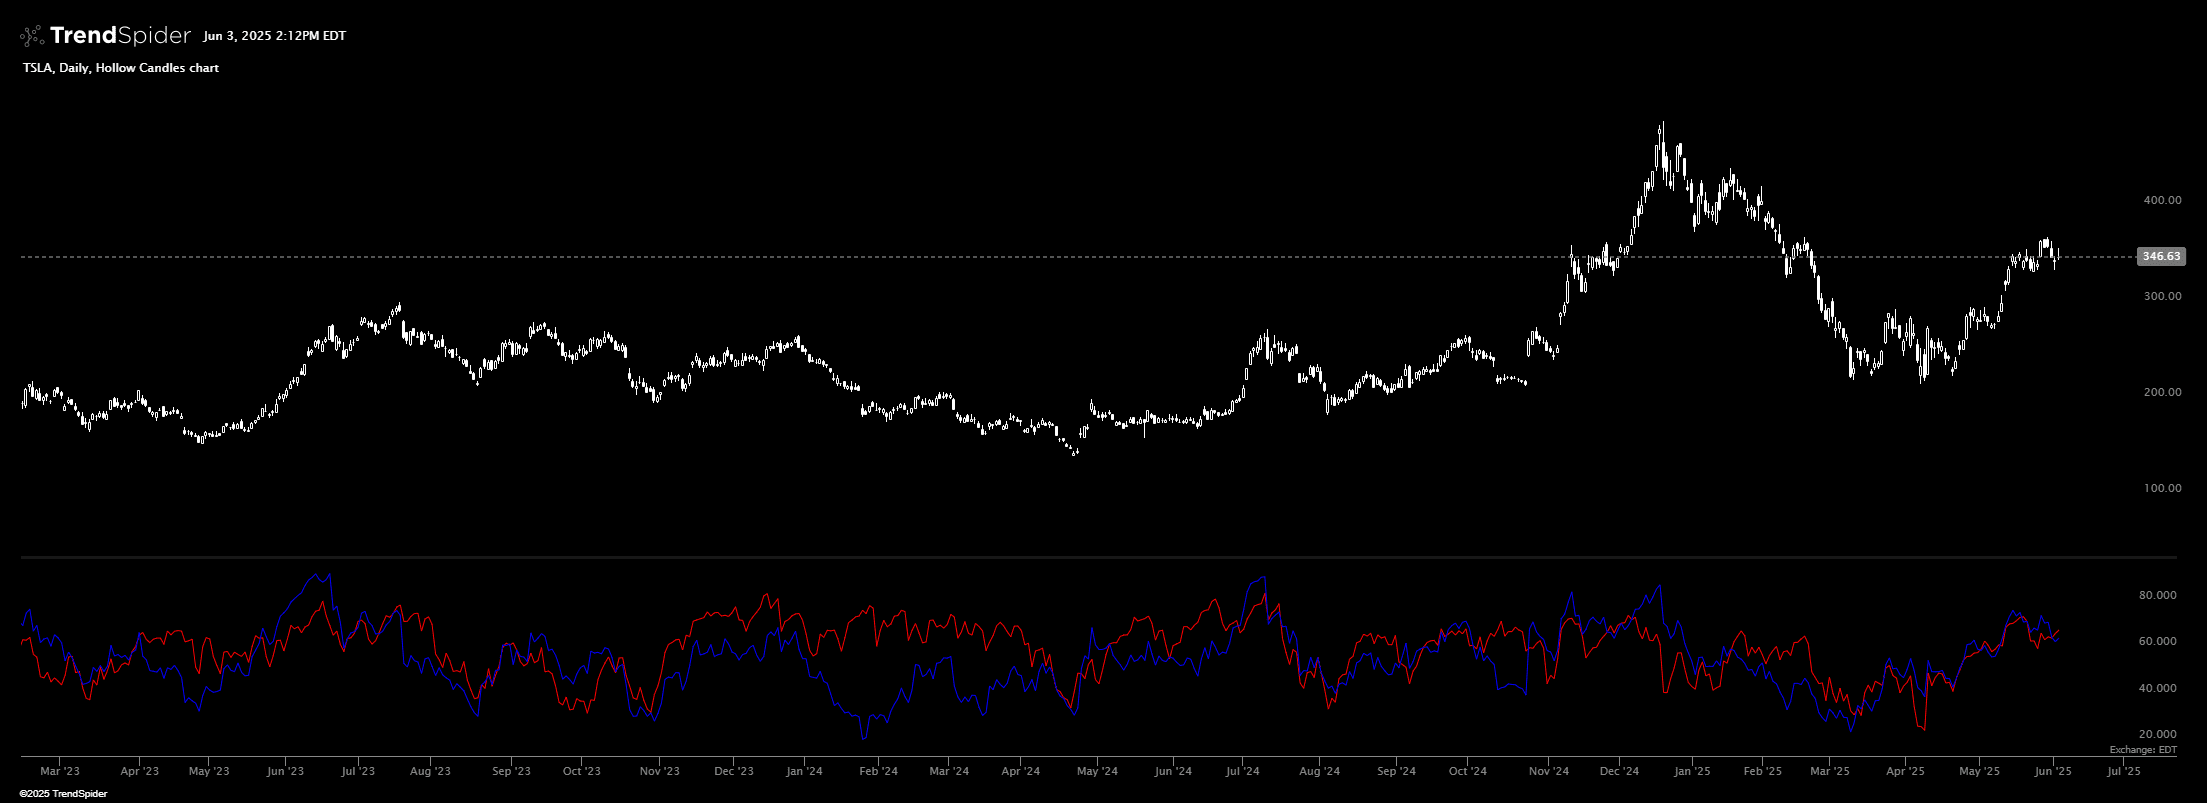
This indicator overlays the Relative Strength Index (RSI) of two different tickers into a single lower indicator for easy comparison. By default, it compares the RSI of the current symbol on the chart to the RSI of SPY. However, the second RSI (SPY) can be customized to a ticker of your choice through the indicator settings
Source code
This indicator had been implemented by James in JavaScript on TrendSpider. Check out the developer documentation to learn more about JS on TrendSpider.
// This indicator dynamically calculates RSIs for SPY and the chart's ticker symbol. It was created with the help of AI and has not been quality checked.
describe_indicator('2 RSIs Dynamic', 'lower');

// Input for the first symbol (default is SPY, but user can change it)
const symbol1 = input.symbol('Symbol1 (Custom)', 'SPY');

// The second RSI always uses the ticker on the chart
const symbol2 = current.ticker;

// Input for RSI length
const rsiLength = input.number('RSI Length', 14, { min: 1, max: 100 });

// Fetch historical data for the first symbol
const data1 = await request.history(symbol1, current.resolution);

// Fetch historical data for the second symbol (chart's ticker)
const data2 = await request.history(symbol2, current.resolution);

// Calculate and paint the RSI for the first symbol (customizable)
const rsi1 = rsi(data1.close, rsiLength);
paint(
    interpolate_sparse_series(land_points_onto_series(data1.time, rsi1, time), "constant"),
    { name: 'RSI1 (Custom)', color: 'red' }
);

// Calculate and paint the RSI for the second symbol (chart's ticker)
const rsi2 = rsi(data2.close, rsiLength);
paint(
    interpolate_sparse_series(land_points_onto_series(data2.time, rsi2, time), "constant"),
    { name: 'RSI2 (Chart Symbol)', color: 'blue' }
);
Automated technical analysis software. For traders, by traders.