Smoothed HA Histogram
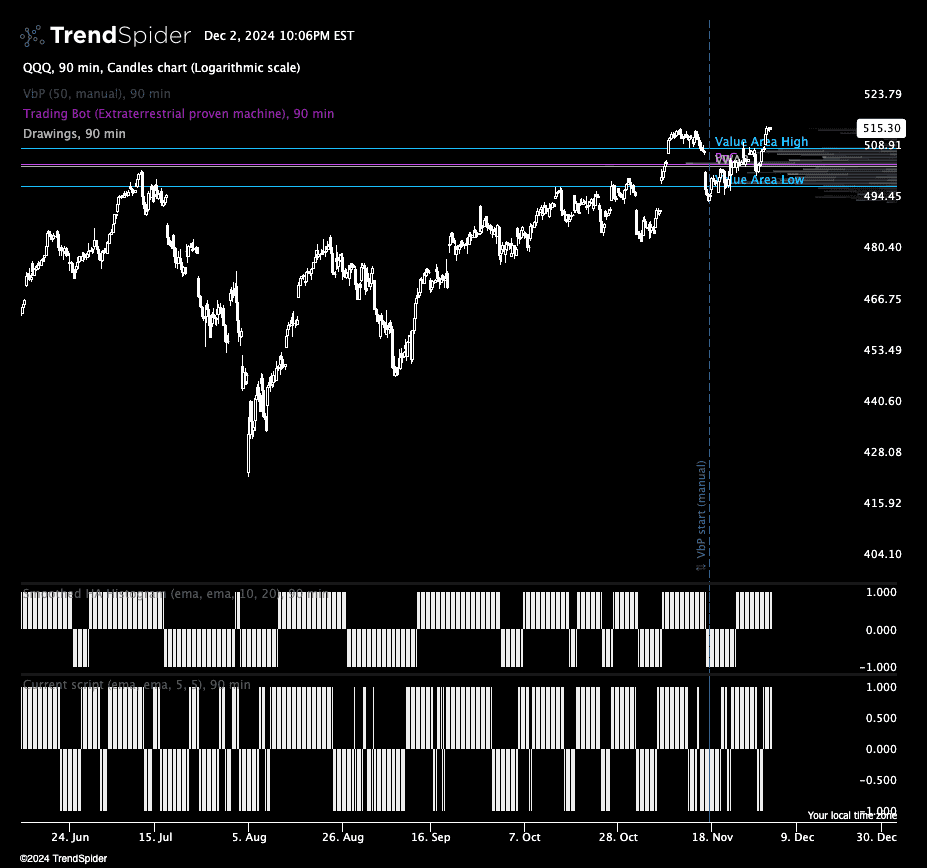
Source code
This indicator had been implemented by Dan Ushman in JavaScript on TrendSpider. Check out the developer documentation to learn more about JS on TrendSpider.
// Smoothed HA Histogram
describe_indicator('Smoothed HA Histogram', 'lower');

const beforeMAType = input('Before MA', 'ema', constants.ma_types);
const afterMAType = input('After MA', 'ema', constants.ma_types);

const smoothLength = input('Before Smooth', 5, { min: 1, max: 100 });
const afterSmoothLength = input('After Smooth', 5, { min: 1, max: 100 });

const smoothOpen = indicators[beforeMAType](open, smoothLength);
const smoothHigh = indicators[beforeMAType](high, smoothLength);
const smoothLow = indicators[beforeMAType](low, smoothLength);
const smoothClose = indicators[beforeMAType](close, smoothLength);

const haOpenSeries = series_of(null);
const haHighSeries = series_of(null);
const haLowSeries = series_of(null);
const haCloseSeries = series_of(null);

for (let candleIndex = 0; candleIndex < time.length; candleIndex += 1) {
    const haClose = (smoothOpen[candleIndex] + smoothHigh[candleIndex] + smoothLow[candleIndex] + smoothClose[candleIndex]) / 4;

    const haOpen = haOpenSeries[candleIndex - 1]
        ? ((haOpenSeries[candleIndex - 1] + haCloseSeries[candleIndex - 1]) / 2)
        : ((smoothOpen[candleIndex] + smoothClose[candleIndex]) / 2);

    const haHigh = Math.max(smoothHigh[candleIndex], haClose, haOpen);
    const haLow = Math.min(smoothLow[candleIndex], haClose, haOpen);

    haOpenSeries[candleIndex] = haOpen;
    haCloseSeries[candleIndex] = haClose;
    haHighSeries[candleIndex] = haHigh;
    haLowSeries[candleIndex] = haLow;
}

const haSmoothOpenSeries = indicators[afterMAType](haOpenSeries, afterSmoothLength);
const haSmoothCloseSeries = indicators[afterMAType](haCloseSeries, afterSmoothLength);

// Create histogram values: +1 for green candles, -1 for red candles
const histogram = series_of(null);

for (let i = 0; i < haSmoothOpenSeries.length; i++) {
    if (haSmoothCloseSeries[i] > haSmoothOpenSeries[i]) {
        histogram[i] = 1; // Green candle
    } else {
        histogram[i] = -1; // Red candle
    }
}

// Paint the histogram
paint(histogram, {
    style: 'histogram',
    color: histogram.map(value => (value > 0 ? '#eeeeee' : '#eeeeee')),
    width: 2, // Adjust histogram bar width if needed
});
Automated technical analysis software. For traders, by traders.