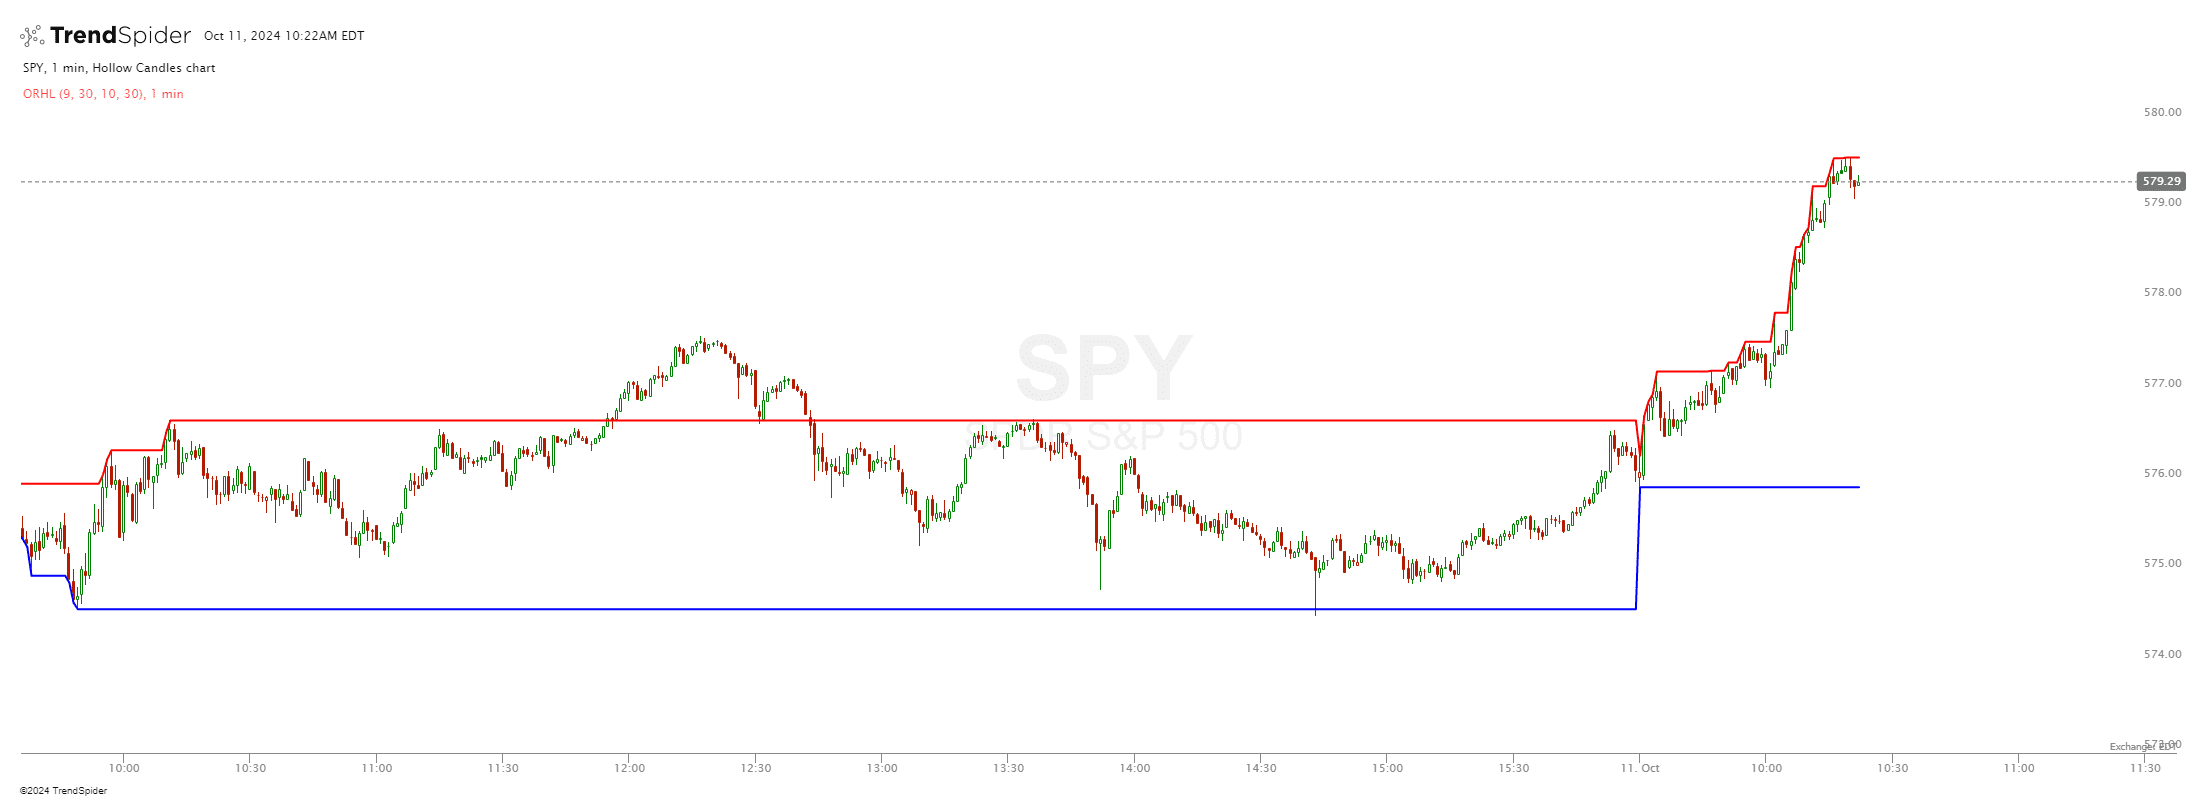
Opening Range High and Low with Selectable Times
Source code
This indicator had been implemented by James in JavaScript on TrendSpider. Check out the developer documentation to learn more about JS on TrendSpider.
// This indicator was made by AI and has not been QA checked by the TrendSpider development team. The indicator is for entertainment purposes only.

describe_indicator('Opening Range High and Low with Selectable Times', 'price', { shortName: 'ORHL' });

// Ensure the indicator does not work on Session, Daily, Weekly, Monthly, Quarterly, or Yearly charts
assert(
    !['D', 'W', 'M', 'Q', 'Y'].includes(constants.resolution),
    `not applicable to "${constants.resolution}" charts`
);

// Input fields for user-defined start and end times with default values
const startHour = input.number('Start Hour', 9, { min: 0, max: 23 });
const startMinute = input.number('Start Minute', 30, { min: 0, max: 59 });
const endHour = input.number('End Hour', 10, { min: 0, max: 23 });
const endMinute = input.number('End Minute', 30, { min: 0, max: 59 });

// Function to get opening range high and low for each day
function getOpeningRangeHighLow() {
    const openingRangeHighs = series_of(null);
    const openingRangeLows = series_of(null);
    let currentDay = null;
    let openingRangeHigh = -Infinity;
    let openingRangeLow = Infinity;

    for (let i = 0; i < time.length; i++) {
        const date = time_of(time[i]);
        const day = date.dayOfYear;

        // Reset for a new day
        if (day !== currentDay) {
            currentDay = day;
            openingRangeHigh = -Infinity;
            openingRangeLow = Infinity;
        }

        // Check if the current time is within the user-defined range
        if (
            (date.hours > startHour || (date.hours === startHour && date.minutes >= startMinute)) &&
            (date.hours < endHour || (date.hours === endHour && date.minutes <= endMinute))
        ) {
            // Update high and low for the opening range
            if (high[i] > openingRangeHigh) {
                openingRangeHigh = high[i];
            }
            if (low[i] < openingRangeLow) {
                openingRangeLow = low[i];
            }
        }

        // Assign the calculated values to the series
        openingRangeHighs[i] = openingRangeHigh;
        openingRangeLows[i] = openingRangeLow;
    }
    return { openingRangeHighs, openingRangeLows };
}

// Get the opening range high and low series
const { openingRangeHighs, openingRangeLows } = getOpeningRangeHighLow();

// Paint the opening range high and low on the chart
paint(openingRangeHighs, { style: 'line', color: 'red', thickness: 2, name: 'OR High' });
paint(openingRangeLows, { style: 'line', color: 'blue', thickness: 2, name: 'OR Low' });
Automated technical analysis software. For traders, by traders.