RSI Ensemble
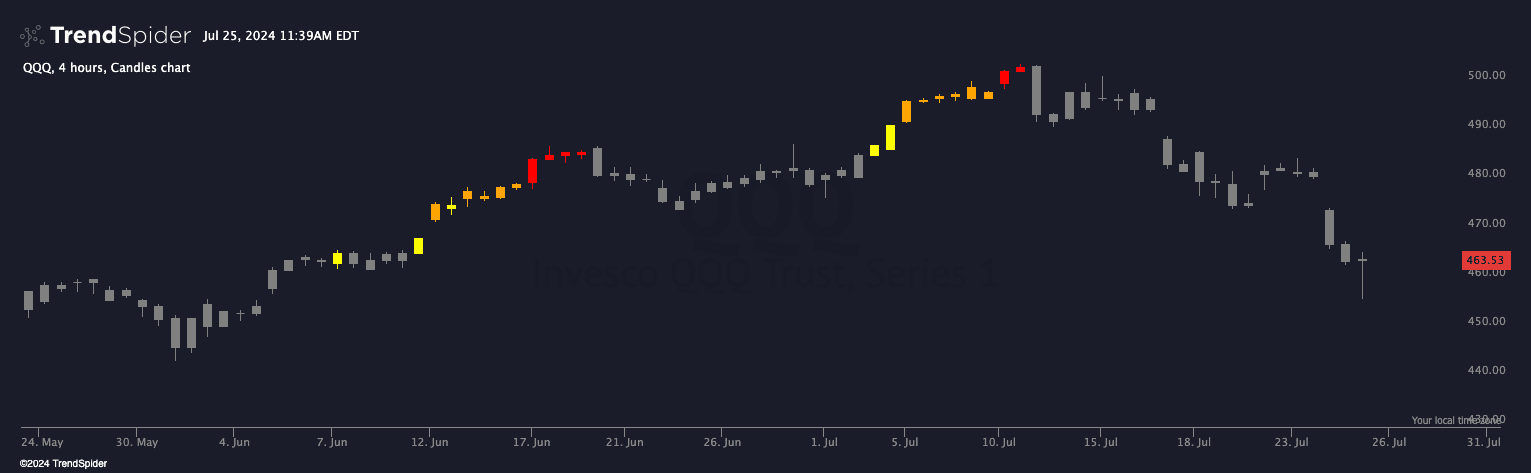
This sample indicator colors each candle according to how 3 RSIs (14, 9, 5) signal "overbought" for it. A candle will be gray if none of the RSIs are current overbought. A candle will be yellow if only one of them is overbought. A candle will be orange if 2 RSIs signal "overbought", and it will be red if all 3 of RSIs are in agreement that the stock is overbought.
Source code
This indicator had been implemented by TrendSpider in JavaScript on TrendSpider. Check out the developer documentation to learn more about JS on TrendSpider.
// This sample indicator colors each candle according to how 3 RSIs (14, 9, 5) signal "overbought"
// for it. A candle will be gray if none of the RSIs are current overbought. A candle will be yellow if only
// one of them is overbought. A candle will be orange if 2 RSIs signal "overbought", and it will be
// red if all 3 of RSIs are in agreement that the stock is overbought.
//
// This indicator also provides a signal named "Surely Overbought", which emerges
// any time all 3 RSIs are signaling Overbought. It also provides a signal named
// "Probably Overbought", which emerges when 2 of 3 RSIs are in agreement that it's overbought.
// These signals can be used in scanning, backtesting and such, while the actual
// candle color can't.

describe_indicator('RSI Ensemble');

const OVERBOUGHT_LEVEL = 80;

const COLOR_BY_SCORE = {
    0: 'gray',
    1: 'yellow',
    2: 'orange',
    3: 'red'
};

const scoreOfRSI = length => for_every(
    rsi(close, length),
    rsiValue => rsiValue > OVERBOUGHT_LEVEL ? 1 : 0
);

const summaryScores = add(
    scoreOfRSI(14),
    scoreOfRSI(9),
    scoreOfRSI(5)
);

color_candles(for_every(summaryScores, score => COLOR_BY_SCORE[score]));

register_signal(summaryScores.map(value => value === 3), 'Surely Overbought');
register_signal(summaryScores.map(value => value === 2), 'Probably Overbought');
Automated technical analysis software. For traders, by traders.