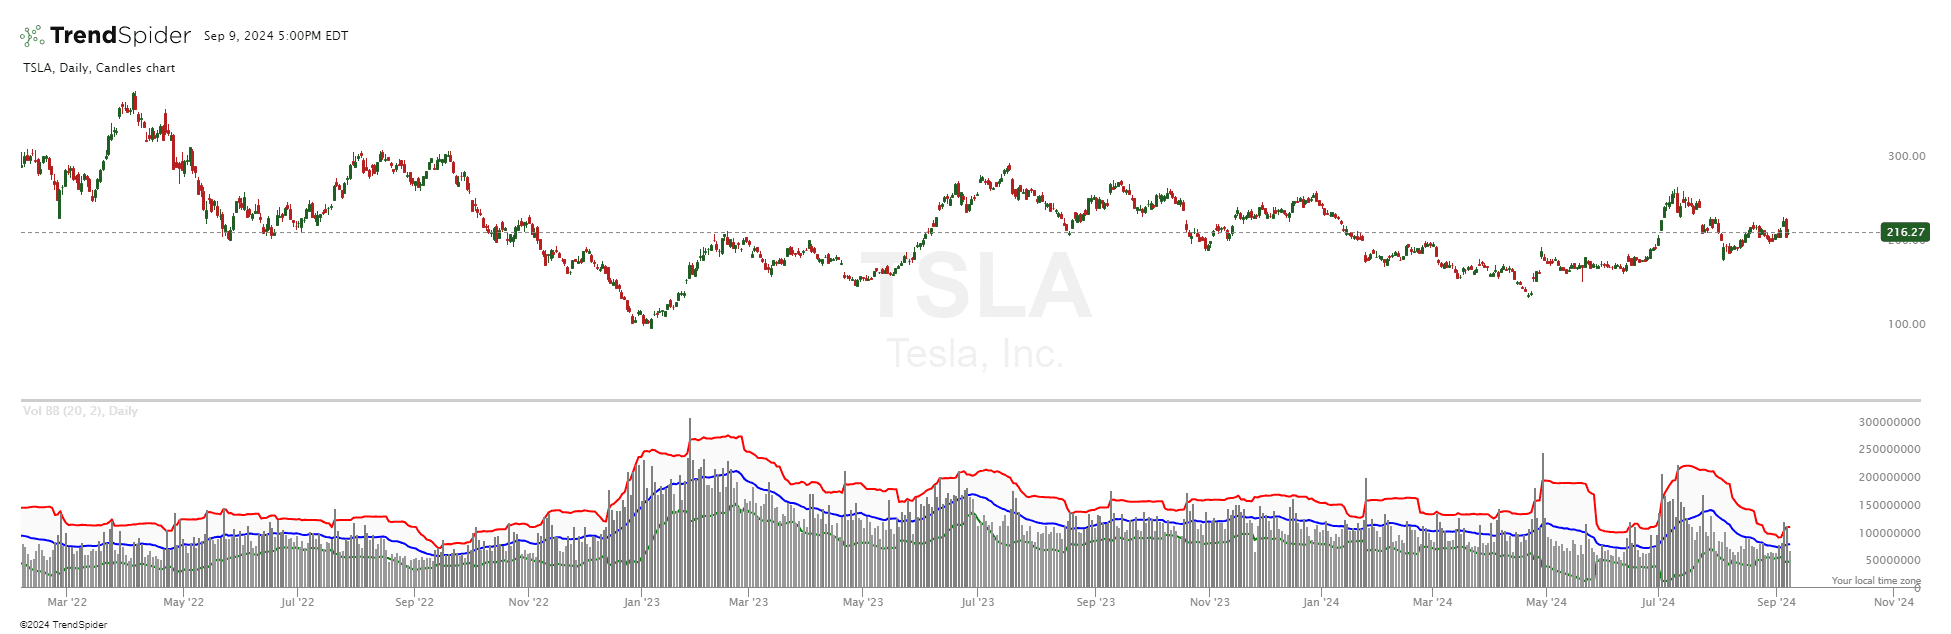
Volume Bollinger Bands with Breakout/Capitulation
Source code
This indicator had been implemented by James in JavaScript on TrendSpider. Check out the developer documentation to learn more about JS on TrendSpider.
describe_indicator('Volume Bollinger Bands with Breakout/Capitulation', 'lower', { decimals: 0, shortName: 'Vol BB+' });

// Input parameters for the Bollinger Bands calculation
const length = input.number('Length', 20, { min: 1, max: 100 });
const multiplier = input.number('Multiplier', 2, { min: 0.1, max: 5 });
const breakoutMultiplier = input.number('Breakout Multiplier', 2, { min: 1, max: 5 });
const lookbackPeriod = input.number('Lookback Period', 5, { min: 1, max: 20 });

// Calculate the moving average of volume
const maVolume = sma(volume, length);

// Calculate the standard deviation of volume
const stdevVolume = stdev(volume, length);

// Calculate the upper and lower Bollinger Bands
const upperBand = add(maVolume, mult(stdevVolume, multiplier));
const lowerBand = sub(maVolume, mult(stdevVolume, multiplier));

// Calculate the breakout threshold
const breakoutThreshold = add(maVolume, mult(stdevVolume, breakoutMultiplier));

// Determine the highest and lowest close of the previous period
const highestClose = shift(highest(close, lookbackPeriod), 1);
const lowestClose = shift(lowest(close, lookbackPeriod), 1);

// Detect breakouts and capitulations
const isBreakout = for_every(volume, close, highestClose, (v, c, h) => v > breakoutThreshold[volume.indexOf(v)] && c > h);
const isCapitulation = for_every(volume, close, lowestClose, (v, c, l) => v > breakoutThreshold[volume.indexOf(v)] && c < l);

// Color the volume bars
const volumeColor = for_every(volume, maVolume, isBreakout, isCapitulation, (v, ma, b, c) => {
    if (b) return 'green';
    if (c) return 'red';
    return v > ma ? 'grey' : '#999';
});

// Paint the moving average of volume
paint(maVolume, { name: 'MA Volume', color: 'blue', thickness: 2 });

// Paint the upper Bollinger Band
paint(upperBand, { name: 'Upper Band', color: 'red', thickness: 2 });

// Paint the lower Bollinger Band
paint(lowerBand, { name: 'Lower Band', color: 'green', thickness: 2 });

// Paint the actual volume
paint(volume, { name: 'Volume', style: 'histogram', color: volumeColor });

// Fill the area between the bands
fill(
    paint(upperBand, { hidden: true }),
    paint(lowerBand, { hidden: true }),
    '#cccccc',
    0.1
);

// Add breakout and capitulation labels and register signals
for_every(isBreakout, isCapitulation, (b, c, _, i) => {
    if (b) {
        paint_label_at_line(paint(close), i, 'B', { color: 'green', vertical_align: 'top' });
    } else if (c) {
        paint_label_at_line(paint(close), i, 'C', { color: 'red', vertical_align: 'bottom' });
    }
});

// Register signals separately
register_signal(isBreakout, 'Breakout');
register_signal(isCapitulation, 'Capitulation');
Automated technical analysis software. For traders, by traders.