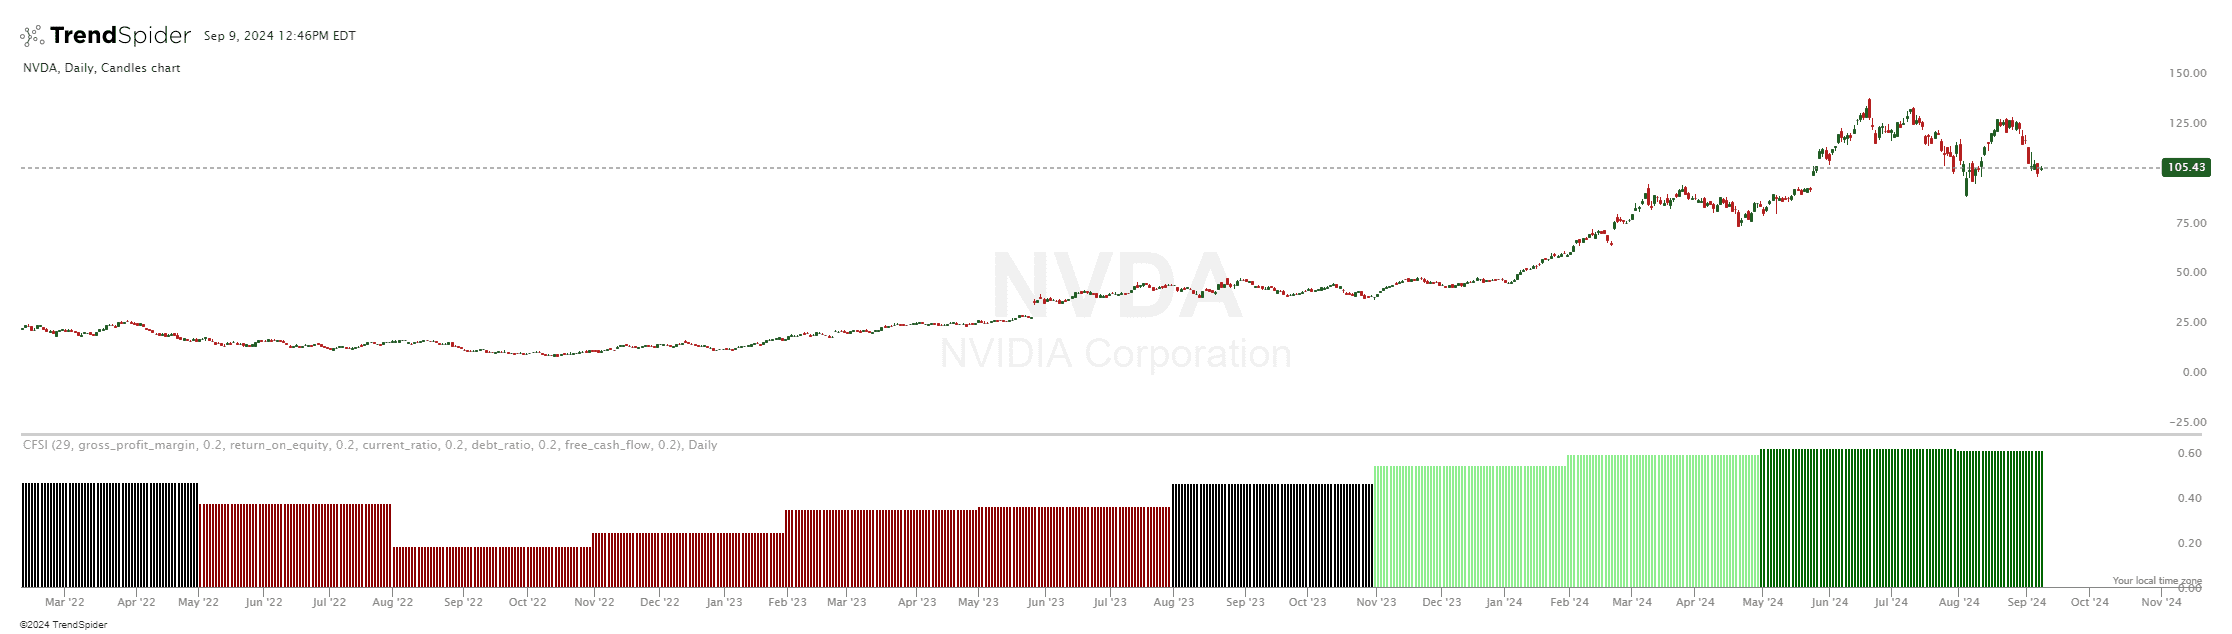
Fundamental Strength Indicator Final w/ Weighting
Source code
This indicator had been implemented by James in JavaScript on TrendSpider. Check out the developer documentation to learn more about JS on TrendSpider.
// This indicator code was potentially generated using AI. It was not checked by Quality Assurance
// and did not pass any quality assurance processes that we normally would use at TrendSpider
// As a result, I can’t guarantee that it will operate as expected in all cases and you should
// use caution when using this indicator. Consider it for informational purposes only.
// testing testing

// Import necessary libraries
const moment = library('moment-timezone');

// Declare the indicator with a user-friendly name and type
describe_indicator('Fundamental Strength Indicator Final w/ Weighting', 'lower', {
    shortName: 'CFSI',
    decimals: 2
});

// Input parameters for the number of quarters to fetch
const quarters = input('Number of Quarters', 29);
const metric1 = input('Metric 1', 'gross_profit_margin', [
    'gross_profit_margin', 'return_on_equity', 'current_ratio', 'debt_ratio', 'free_cash_flow',
    'net_income', 'operating_margin', 'revenue', 'ebitda', 'fcf_to_net_income',
    'book_to_market_value', 'cash_cash_equivalents', 'debt_to_equity_ratio', 'net_profit_margin',
    'total_assets', 'total_equity', 'total_liabilities', 'pretax_income_loss_adj',
    'net_income_discontinued_operations', 'eps_diluted'
]);
const weight1 = input('Weight 1', 0.2, { min: 0, max: 1, step: 0.01 });

const metric2 = input('Metric 2', 'return_on_equity', [
    'gross_profit_margin', 'return_on_equity', 'current_ratio', 'debt_ratio', 'free_cash_flow',
    'net_income', 'operating_margin', 'revenue', 'ebitda', 'fcf_to_net_income',
    'book_to_market_value', 'cash_cash_equivalents', 'debt_to_equity_ratio', 'net_profit_margin',
    'total_assets', 'total_equity', 'total_liabilities', 'pretax_income_loss_adj',
    'net_income_discontinued_operations', 'eps_diluted'
]);
const weight2 = input('Weight 2', 0.2, { min: 0, max: 1, step: 0.01 });

const metric3 = input('Metric 3', 'current_ratio', [
    'gross_profit_margin', 'return_on_equity', 'current_ratio', 'debt_ratio', 'free_cash_flow',
    'net_income', 'operating_margin', 'revenue', 'ebitda', 'fcf_to_net_income',
    'book_to_market_value', 'cash_cash_equivalents', 'debt_to_equity_ratio', 'net_profit_margin',
    'total_assets', 'total_equity', 'total_liabilities', 'pretax_income_loss_adj',
    'net_income_discontinued_operations', 'eps_diluted'
]);
const weight3 = input('Weight 3', 0.2, { min: 0, max: 1, step: 0.01 });

const metric4 = input('Metric 4', 'debt_ratio', [
    'gross_profit_margin', 'return_on_equity', 'current_ratio', 'debt_ratio', 'free_cash_flow',
    'net_income', 'operating_margin', 'revenue', 'ebitda', 'fcf_to_net_income',
    'book_to_market_value', 'cash_cash_equivalents', 'debt_to_equity_ratio', 'net_profit_margin',
    'total_assets', 'total_equity', 'total_liabilities', 'pretax_income_loss_adj',
    'net_income_discontinued_operations', 'eps_diluted'
]);
const weight4 = input('Weight 4', 0.2, { min: 0, max: 1, step: 0.01 });

const metric5 = input('Metric 5', 'free_cash_flow', [
    'gross_profit_margin', 'return_on_equity', 'current_ratio', 'debt_ratio', 'free_cash_flow',
    'net_income', 'operating_margin', 'revenue', 'ebitda', 'fcf_to_net_income',
    'book_to_market_value', 'cash_cash_equivalents', 'debt_to_equity_ratio', 'net_profit_margin',
    'total_assets', 'total_equity', 'total_liabilities', 'pretax_income_loss_adj',
    'net_income_discontinued_operations', 'eps_diluted'
]);
const weight5 = input('Weight 5', 0.2, { min: 0, max: 1, step: 0.01 });

const metrics = [metric1, metric2, metric3, metric4, metric5];
const weights = [weight1, weight2, weight3, weight4, weight5];

// Fetch fundamental data for the ticker
const ticker = current.ticker;
const fundamentalData = await request.fundamental(ticker, metrics, quarters);
assert(!fundamentalData.error, `Error fetching fundamental data: ${fundamentalData.error}`);

// Extract fundamental metrics and their timestamps
function getMetricData(data, metric) {
    return data[metric].map(dp => ({ value: dp.value, timestamp: dp.reportdate }));
}

// Normalize the data between 0 and 1
function normalize(data) {
    const values = data.map(d => d.value);
    const min = Math.min(...values);
    const max = Math.max(...values);
    return data.map(d => ({ ...d, value: (d.value - min) / (max - min) }));
}

// Create series for each selected metric
const metricSeries = {};
metrics.forEach((metric, index) => {
    const data = getMetricData(fundamentalData, metric);
    const normalizedData = normalize(data);
    metricSeries[`metric${index + 1}`] = series_of(null);

    for (let i = 0; i < time.length; i++) {
        const currentTimestamp = time[i];
        const value = normalizedData.find(d => d.timestamp <= currentTimestamp);
        metricSeries[`metric${index + 1}`][i] = value ? value.value : null;
    }
});

// Create series for the composite score over time
const compositeScoreSeries = series_of(null);
const compositeScoreColors = series_of(null);

for (let i = 0; i < time.length; i++) {
    const scores = metrics.map((metric, index) => metricSeries[`metric${index + 1}`][i]);
    if (scores.every(score => score !== null)) {
        const compositeScore = scores.reduce((acc, score, index) => acc + score * weights[index], 0);
        compositeScoreSeries[i] = compositeScore;
        compositeScoreColors[i] = compositeScore > 0.6 ? 'darkgreen' : compositeScore > 0.5 ? 'lightgreen' : compositeScore > 0.4 ? 'lightred' : 'darkred';
    } else {
        compositeScoreSeries[i] = null;
        compositeScoreColors[i] = null;
    }
}

// Paint the indicator on the chart as a histogram with colors
paint(compositeScoreSeries, {
    name: 'Fundamental Strength Indicator',
    color: compositeScoreColors,
    thickness: 2,
    style: 'column'
});
Automated technical analysis software. For traders, by traders.