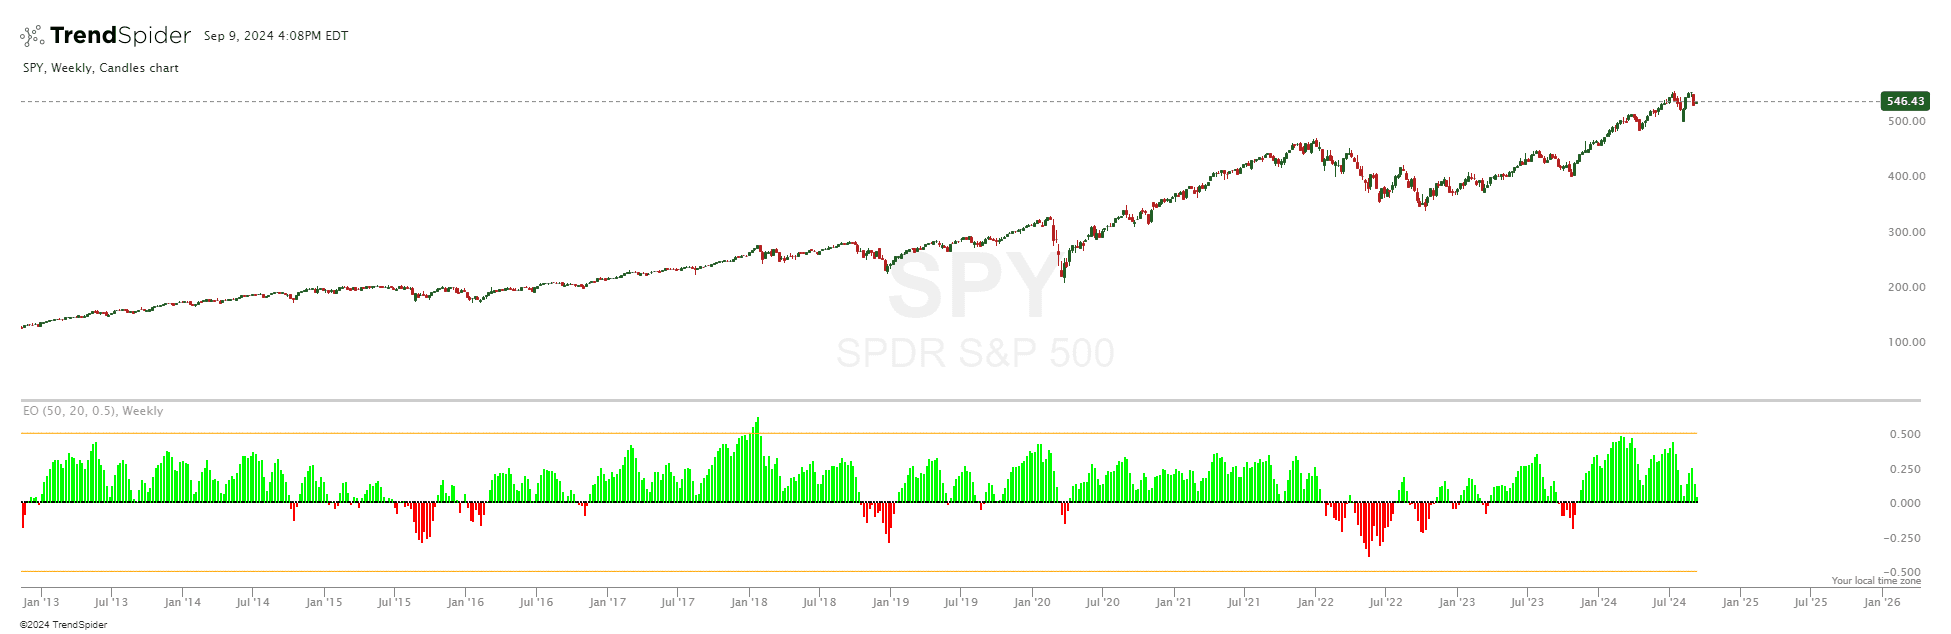
Elegant Oscillator
Source code
This indicator had been implemented by James in JavaScript on TrendSpider. Check out the developer documentation to learn more about JS on TrendSpider.
// Indicator: Elegant Oscillator
describe_indicator('Elegant Oscillator', 'lower', { shortName: 'EO' });

// Inputs
const rmsLength = input.number('RMS Length', 50, { min: 1 });
const cutoffLength = input.number('Cutoff Length', 20, { min: 1 });
const threshold = input.number('Threshold', 0.5, { min: 0, max: 1 });

// Calculate the derivative and RMS
const derivative = sub(close, shift(close, 2));
const rms = sma(mult(derivative, derivative), rmsLength).map(Math.sqrt);

// Normalize the derivative and calculate the IFT
const normDerivative = div(derivative, rms);
const ift = normDerivative.map(value => (Math.exp(2 * value) - 1) / (Math.exp(2 * value) + 1));

// Smooth the IFT
const elegantOsc = ema(ift, cutoffLength);

// Generate color series for the oscillator
const oscColors = elegantOsc.map(value => (value >= 0 ? '#00FF00' : '#FF0000'));

// Plot the oscillator with threshold lines as a histogram
paint(elegantOsc, {
  name: 'Elegant Oscillator',
  style: 'histogram',
  color: oscColors
});

paint(horizontal_line(threshold), 'Upper Level', '#FFA500');
paint(horizontal_line(0), 'Zero Line', '#000000', 'dotted');
paint(horizontal_line(-threshold), 'Lower Level', '#FFA500');
Automated technical analysis software. For traders, by traders.