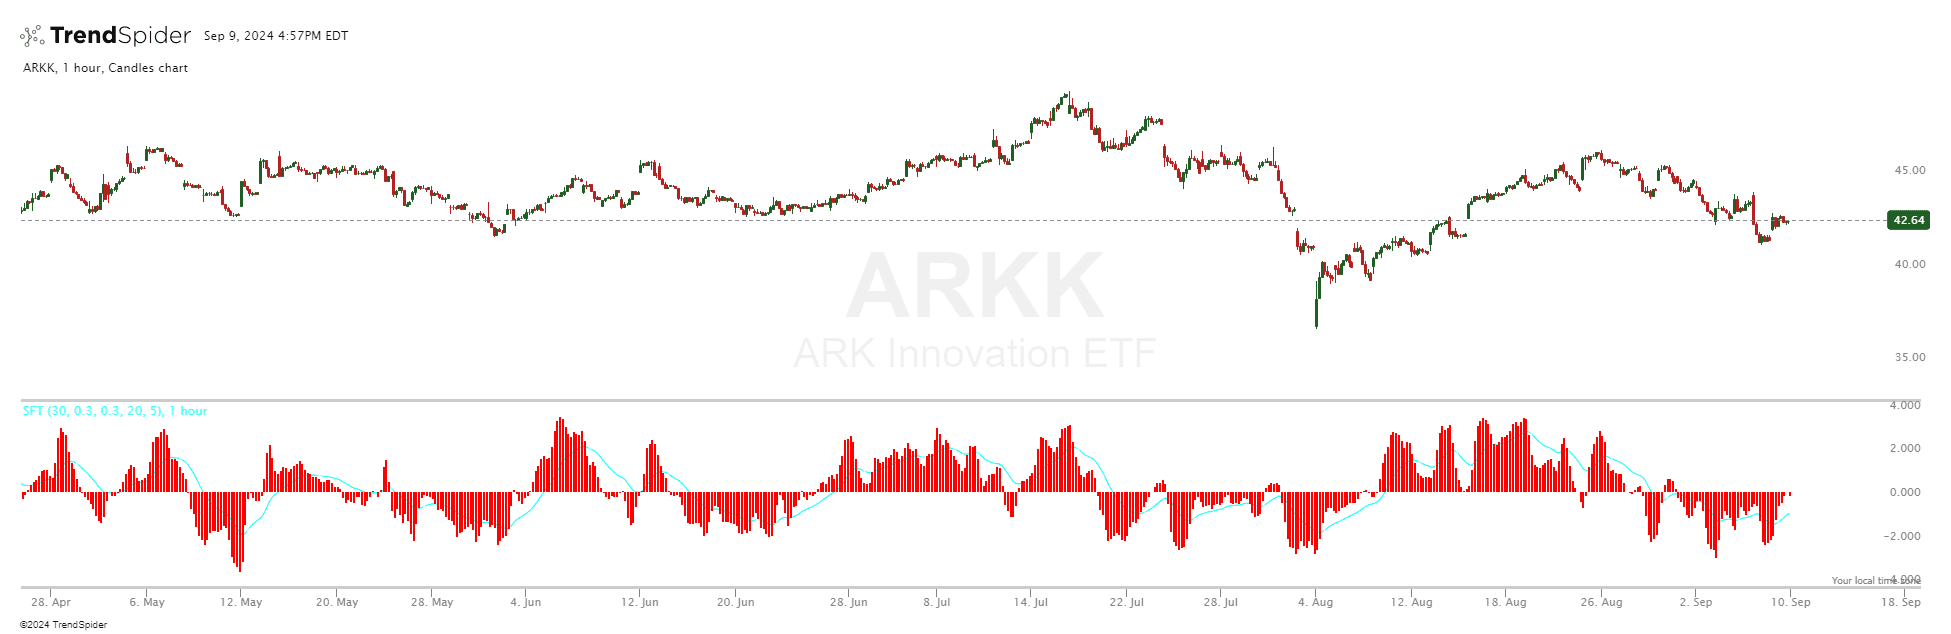
Smoothed Fisher Transform
Source code
This indicator had been implemented by James in JavaScript on TrendSpider. Check out the developer documentation to learn more about JS on TrendSpider.
describe_indicator("Smoothed Fisher Transform", "lower", { decimals: 3, shortName: "SFT" });

const rangePeriods = input("Range Periods", 30, { min: 1, max: 200 });
const priceSmoothing = input("Price Smoothing", 0.3, { min: 0, max: 1 });
const indexSmoothing = input("Index Smoothing", 0.3, { min: 0, max: 1 });
const emaLength = input("EMA Length", 20, { min: 1, max: 100 });
const emaLength2 = input("EMA Length 2", 5, { min: 1, max: 100 });

// Highest high and lowest low
const highestHigh = sliding_window_function(high, rangePeriods, values => Math.max(...values));
const lowestLow = sliding_window_function(low, rangePeriods, values => Math.min(...values));

// Price location calculation
const midPrice = div(add(high, low), 2);
const greatestRange = sub(highestHigh, lowestLow);
const priceLocation = sub(div(mult(sub(midPrice, lowestLow), 2), greatestRange), 1);

// Smooth price location
const smoothedLocation = sliding_window_function(priceLocation, 2, window => {
    let extMapBuffer = priceSmoothing * window[1] + (1 - priceSmoothing) * window[0];
    return Math.min(Math.max(extMapBuffer, -0.99), 0.99);
});

// Fisher Transform calculation
const fishIndex = sliding_window_function(smoothedLocation, 1, values => Math.log((1 + values[0]) / (1 - values[0])));

// Smooth Fisher Transform
const smoothedFish = sliding_window_function(fishIndex, 2, window => indexSmoothing * window[1] + (1 - indexSmoothing) * window[0]);

// EMA calculations
const ema1 = ema(smoothedFish, emaLength);
const ema2 = ema(smoothedFish, emaLength2);

// Plotting
paint(ema1, "EMA 1", "#00FFFF");
paint(ema2, "EMA 2", "#FFFFFF");
paint(smoothedFish, "Fish Histogram", smoothedFish[smoothedFish.length - 1] > 0 ? "green" : "red", "histogram");
Automated technical analysis software. For traders, by traders.