MACD & RSI Based Momentum
The MACD & RSI Based Momentum Indicator is one of the most widely used momentum tools on TrendSpider, designed to help traders quickly identify trend strength, market direction, and potential reversals. This indicator combines two of the most popular momentum metrics — MACD and RSI — and visually translates them into clear candle colors so you can spot bullish or bearish momentum at a glance.
Whether you are a day trader, swing trader, or long-term trend follower, this indicator makes it easy to:
Identify strong bullish momentum
Spot weakening trends before they roll over
Confirm bearish strength during downtrends
Detect shifts in momentum using MACD histogram and RSI levels
Build automated strategies with built-in visual scripting signals
By merging MACD crossover behavior with RSI overbought/oversold dynamics, this tool gives you a faster, cleaner read on market conditions — without switching between multiple indicators or panels. Traders use it to improve timing, filter trade setups, and stay aligned with dominant trend momentum.
If you’re looking for a powerful, beginner-friendly, and highly visual way to track momentum on TrendSpider, this indicator delivers reliable clarity with zero clutter.
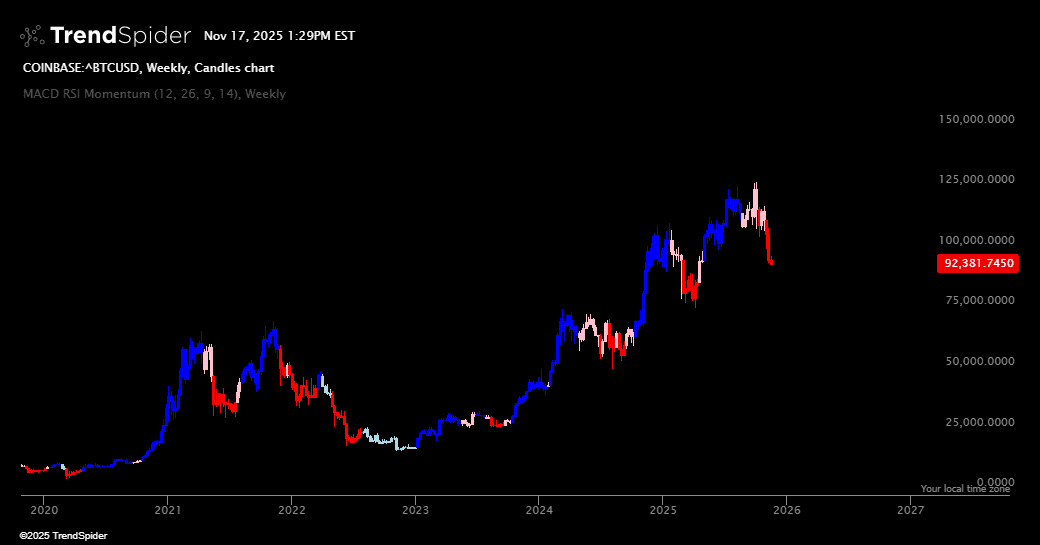
🔵 Blue — Strong Uptrend
Price has strong bullish momentum.
The MACD histogram is positive and RSI is above 50, showing buyers in clear control. Many traders use this as confirmation to stay long or look for long entries.
🔷 Light Blue — Weakening Uptrend
Momentum is still bullish, but fading.
MACD histogram is positive, but RSI has slipped to 50 or below. This often signals an uptrend losing strength or entering consolidation.
🔴 Red — Strong Downtrend
Price has strong bearish momentum.
The MACD histogram is negative and RSI is below 50. Sellers are firmly in control, often signaling continuation to the downside.
🌸 Pink — Weakening Downtrend
Bearish momentum is losing steam.
MACD histogram is negative, but RSI has pushed back up toward 50 or higher. This can hint at a potential reversal, bounce, or pause in selling.
You can reference the candle colors in Visual Scripting in case you want to create a scan, run a backtest, create an alert, or use in a smart checklist. For example, if you want to build a scan that finds where a dark blue candle has emerged (after not being dark blue) then you would create a condition that says....
MACD & RSI Momentum Strong Uptrend 'has emerged'
EDIT: this indicator has been updated. The update has enabled you to create conditions using visual scripting to either backtest, scan, set alerts, or use smart checklist based on the color of the candle. For example, you can now backtest a strategy which enters when the a blue candle emerges.
EDIT 2: This indicator has been updated to allow you to select the length of the MACD (fast and slow), and RSI lengths.
Source code
This indicator had been implemented by James in JavaScript on TrendSpider. Check out the developer documentation to learn more about JS on TrendSpider.
// This indicator was made by AI and has not been QA checked by the TrendSpider development team. The indicator is for informational purposes only.
describe_indicator('MACD & RSI Based Momentum', 'price', {
    shortName: 'MACD RSI Momentum',
    warmup: 250, // Defines the warm-up period for this indicator
});

// Inputs for MACD and RSI lengths
const fastLength = input('MACD Fast Length', 12, { min: 1, max: 100 });
const slowLength = input('MACD Slow Length', 26, { min: 1, max: 100 });
const signalSmoothing = input('MACD Signal Length', 9, { min: 1, max: 100 });
const rsiLength = input('RSI Length', 14, { min: 1, max: 100 });

// MACD components
const fastMA = ema(close, fastLength);
const slowMA = ema(close, slowLength);
const macdLine = sub(fastMA, slowMA);
const signalLine = sma(macdLine, signalSmoothing);
const histogram = sub(macdLine, signalLine);

// RSI calculation
const rsiValues = rsi(close, rsiLength);

// Coloring logic
const candleColors = for_every(histogram, rsiValues, (hist, rsi) => {
    if (hist > 0 && rsi > 50) {
        return 'blue'; // Strong upward trend
    } else if (hist > 0 && rsi <= 50) {
        return 'lightblue'; // Upward trend losing strength
    } else if (hist < 0 && rsi < 50) {
        return 'red'; // Strong downward trend
    } else {
        return 'pink'; // Downward trend losing momentum
    }
});

// Applying the color to candles
color_candles(candleColors);

// Register signals for visual scripting
const strongUptrendSignal = for_every(histogram, rsiValues, (hist, rsi) => hist > 0 && rsi > 50);
const weakUptrendSignal = for_every(histogram, rsiValues, (hist, rsi) => hist > 0 && rsi <= 50);
const strongDowntrendSignal = for_every(histogram, rsiValues, (hist, rsi) => hist < 0 && rsi < 50);
const weakDowntrendSignal = for_every(histogram, rsiValues, (hist, rsi) => hist < 0 && rsi >= 50);

register_signal(strongUptrendSignal, 'Strong Uptrend');
register_signal(weakUptrendSignal, 'Weak Uptrend');
register_signal(strongDowntrendSignal, 'Strong Downtrend');
register_signal(weakDowntrendSignal, 'Weak Downtrend');