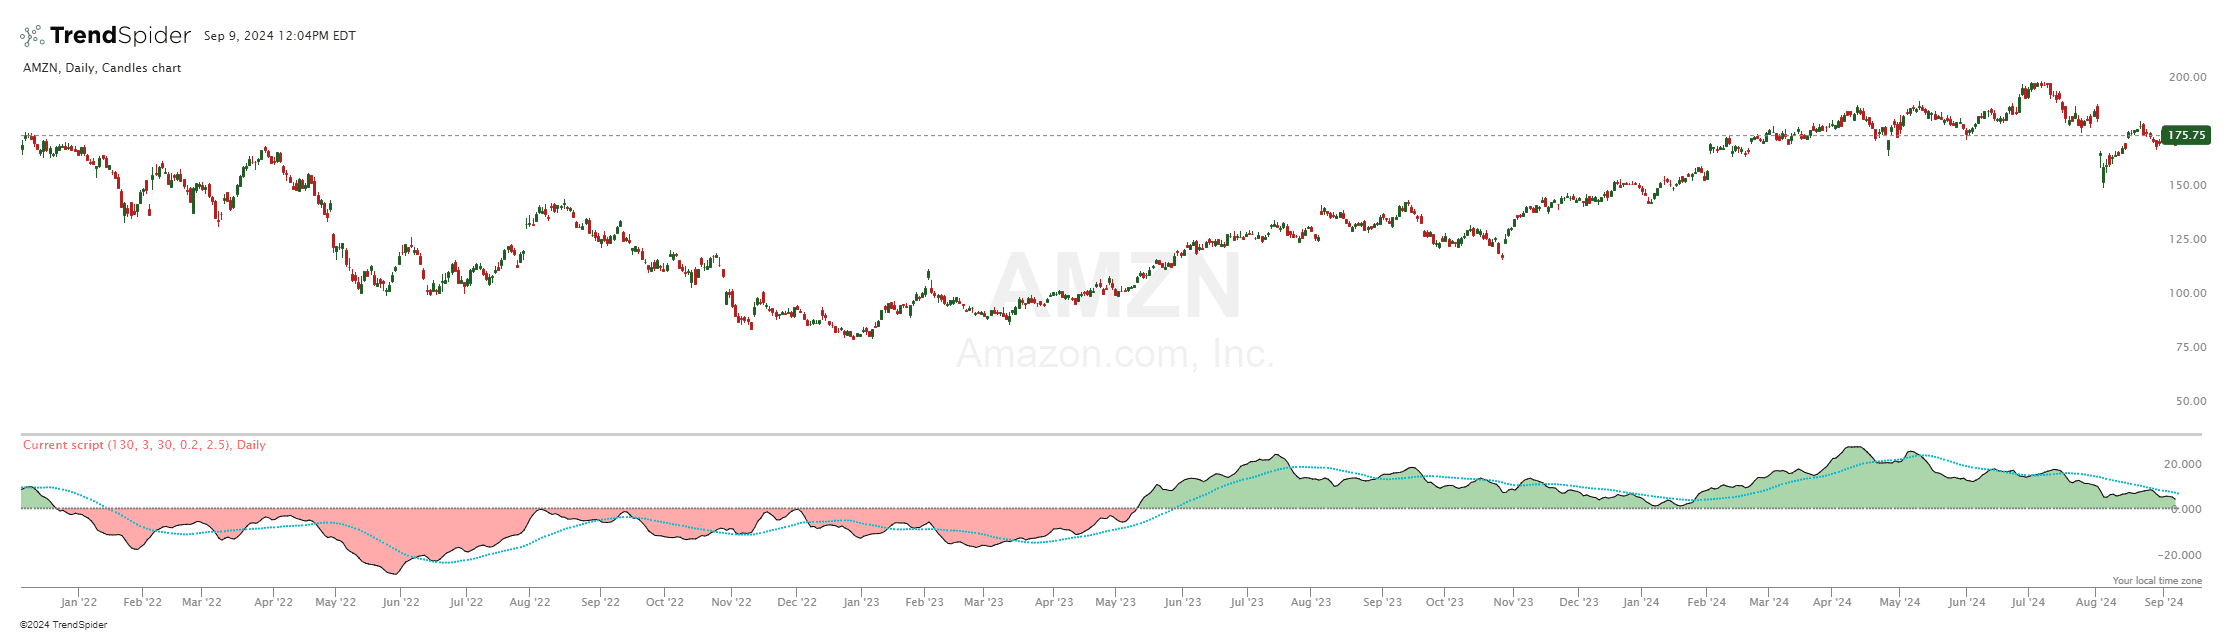
Volume Flow Indicator
Source code
This indicator had been implemented by James in JavaScript on TrendSpider. Check out the developer documentation to learn more about JS on TrendSpider.
describe_indicator('Volume Flow Indicator', 'lower');
const period = input('VFI Period', 130, { min: 26, max: 300 });
const smooth = input('Smooth', 3, { min: 1, max: 10 });
const maPeriod = input('MA Period', 30, { min: 20, max: 100 });
const coef = input('Coef', 0.2);
const volCoef = input('Vol Cutoff', 2.5, { min: 1, max: 5 });
const inter = for_every(hlc3, shift(hlc3, 1), (value, previousValue) => Math.log(value) - Math.log(previousValue));
const vinter = stdev(inter, 30 );
const cutoff = mult(vinter, close, coef);
const vave = shift(sma(volume, period), -1);
const vMax = mult(vave, volCoef);
const vC = min_of(volume, vMax);
const mF = for_every(hlc3, shift(hlc3, 1), (value, previousValue) => value - previousValue);
const vCP = for_every(mF, vC, cutoff, (mFValue, vCValue, cOValue) => {
    if (mFValue > cOValue) {
        return vCValue;
    } else if (mFValue < -cOValue) {
        return -vCValue;
    } else {
        return 0;
    };
});
const vFI1 = div(sum(vCP, period), vave);
const vFI = ema(vFI1, smooth);
const mAVFI = sma(vFI, maPeriod);
paint(vFI, "VFI", 'black');
paint(mAVFI, "MAVFI", '#00bcd4', 'dotted');
const zeroLine = horizontal_line(0);
color_cloud(zeroLine, vFI, 'red', 'green');
paint(zeroLine, 'Zero', 'gray', 'dotted');
Automated technical analysis software. For traders, by traders.