Weinstein Stage Analysis
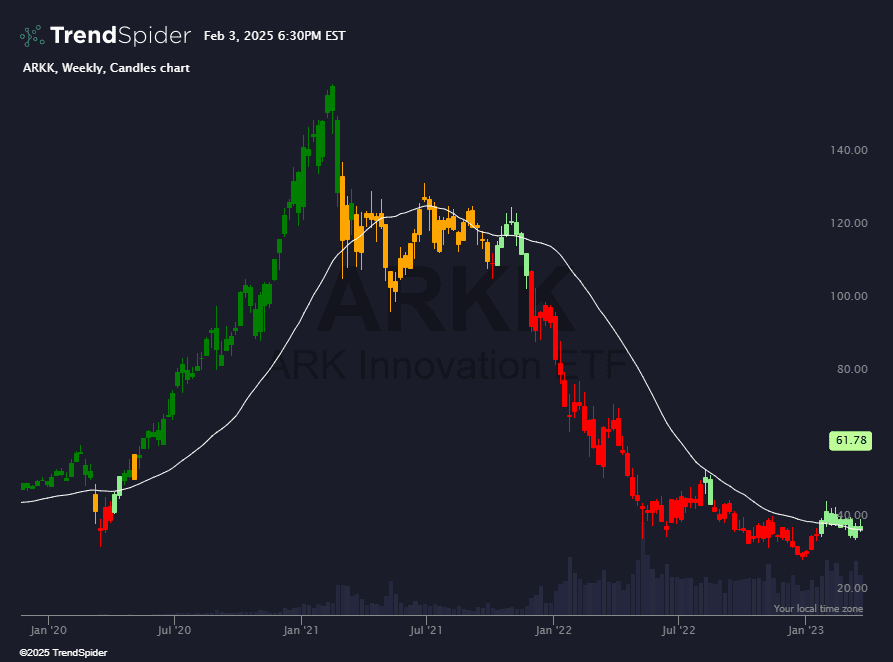
The Weinstein Stage Analysis indicator helps you instantly identify where a stock sits in Stan Weinstein’s classic four-stage cycle. Built around the 30-week moving average, this tool maps accumulation, advancing trends, distribution, and declining phases directly onto your chart with clear, customizable colored candles
- Stage 1 highlights early basing action as price moves sideways near a flattening moving average.
- Stage 2 captures confirmed uptrends when price trades above a rising average.
- Stage 3 marks topping behavior as momentum fades and the average flattens.
- Stage 4 identifies breakdowns as price slips below a declining average with increasing downside pressure.
This indicator includes adjustable moving average types, flexible proximity ranges, and fully labeled stage signals so you can build scans, alerts, and strategies around the entire framework. Whether you are tracking long-term trend health or searching for fresh breakouts and breakdowns, this indicator brings Weinstein’s proven methodology to life inside TrendSpider’s automated ecosystem.
Source code
This indicator had been implemented by TrendSpider in JavaScript on TrendSpider. Check out the developer documentation to learn more about JS on TrendSpider.
// This script had been cloned from "Weinstein Stage Analysis" at 27 Jan 2025, 16:14
describe_indicator('Weinstein Stage Analysis');

// This is an experimental implementation of Weinstein Stage Analysis for candle coloring.
// Please note that this is an interpretation and may not perfectly align with all aspects of the analysis.

const smaLength = input.number('MA Length', 30, { min: 1 });
const withinRangePercent = input.number('Within Range %', 5, { min: 0, max: 25 });

// Allow user to select the moving average type
const maType = input.select('MA Type', 'sma', constants.ma_types);
const computeMA = indicators[maType];

// Allow user to adjust candle colors
const stage2Color = input.color('Stage 2 Color', 'green');
const stage3Color = input.color('Stage 3 Color', 'orange');
const stage4Color = input.color('Stage 4 Color', 'red');
const stage1Color = input.color('Stage 1 Color', 'lightgreen');

// Fetch weekly data
const weeklyData = await request.history(current.ticker, 'W');
assert(!weeklyData.error, `Error fetching weekly data: ${weeklyData.error}`);

const weeklyMA = computeMA(weeklyData.close, smaLength);
const withinRange = mult(weeklyMA, withinRangePercent / 100);

let currentTrend = '';
const myColors = for_every(
    weeklyData.open, weeklyData.close, shift(weeklyData.open, 1), shift(weeklyData.close, 1), weeklyMA, shift(weeklyMA, 1), withinRange,
    (_open, _close, _pOpen, _pClose, _ma, _pMa, _withinRange, _prevColor) => {
        const myBodyLow = Math.min(_open, _close);
        const myBodyHigh = Math.max(_open, _close);

        if (myBodyLow > _ma + _withinRange && _pMa < _ma) {
            currentTrend = 'upward';
            return stage2Color;
        }

        if (myBodyHigh < _ma - _withinRange && _pMa > _ma) {
            currentTrend = 'downward';
            return stage4Color;
        }

        if (currentTrend == 'upward') {
            return stage3Color;
        }

        if (currentTrend == 'downward') {
            return stage1Color;
        }

        return _prevColor || null;
    }
);

// Map weekly colors to the chart's time frame
const myMappedColors = interpolate_sparse_series(land_points_onto_series(weeklyData.time, myColors, time, 'le'), 'constant');
color_candles(myMappedColors);

// Paint the weekly MA for reference
const myMappedMA = land_points_onto_series(weeklyData.time, weeklyMA, time, 'le');
const myInterpolatedMA = interpolate_sparse_series(myMappedMA, 'linear');
paint(myInterpolatedMA, { name: `Weekly ${maType.toUpperCase()}`, color: 'white' });

// Create signals based on candle colors
const myGreenSignal = for_every(myMappedColors, _color => _color === stage2Color ? 1 : 0);
const myOrangeSignal = for_every(myMappedColors, _color => _color === stage3Color ? 1 : 0);
const myRedSignal = for_every(myMappedColors, _color => _color === stage4Color ? 1 : 0);
const myLightGreenSignal = for_every(myMappedColors, _color => _color === stage1Color ? 1 : 0);

register_signal(myGreenSignal, 'Stage 2');
register_signal(myOrangeSignal, 'Stage 3');
register_signal(myRedSignal, 'Stage 4');
register_signal(myLightGreenSignal, 'Stage 1');